
Superset Pinot testing - Batch Data
Apache Pinot Batch Data Example With Superset
This page covers ingesting batch data into Pinot and querying it from Superset.
Info
Assumption: Apache Pinot and Superset are already installed and running.
Set up: Define Host Variable
# Set to current machine hostname
export PINOT_HOST=$(hostname -f)
# Verify
echo "Pinot Host: $PINOT_HOST"
Step 1: Ingest Batch Data into Pinot
Choose an Example Dataset
Pinot includes several example datasets in examples/batch/:
Dataset | Description |
|---|---|
airlineStats | Flight statistics data |
baseballStats | Baseball player statistics |
billing | Billing records |
starbucksStores | Starbucks store locations |
githubEvents | GitHub event data |
Create Schema and Table
cd /path/to/pinot
# Create schema
bin/pinot-admin.sh AddSchema \
-schemaFile examples/batch/airlineStats/airlineStats_schema.json \
-controllerHost $PINOT_HOST \
-controllerPort 9000 \
-exec
# Create table
bin/pinot-admin.sh AddTable \
-tableConfigFile examples/batch/airlineStats/airlineStats_offline_table_config.json \
-schemaFile examples/batch/airlineStats/airlineStats_schema.json \
-controllerHost $PINOT_HOST \
-controllerPort 9000 \
-exec
Verify:
curl http://$PINOT_HOST:9000/schemas # Should list: airlineStats
curl http://$PINOT_HOST:9000/tables # Should list: airlineStats_OFFLINE
If AddTable fails or tables list is empty, use curl instead:
curl -X POST "http://$PINOT_HOST:9000/tables" \
-H "Content-Type: application/json" \
-d @examples/batch/airlineStats/airlineStats_offline_table_config.json
Ingest Data
Update the default ingestion job file to use your hostname (creates .bak backup):
sed -i.bak "s/localhost/$PINOT_HOST/g" examples/batch/airlineStats/ingestionJobSpec.yaml
Run the ingestion:
bin/pinot-admin.sh LaunchDataIngestionJob \
-jobSpecFile examples/batch/airlineStats/ingestionJobSpec.yaml
Info
To restore the original file: mv examples/batch/airlineStats/ingestionJobSpec.yaml.bak examples/batch/airlineStats/ingestionJobSpec.yaml
Verify Data
bin/pinot-admin.sh PostQuery \
-brokerHost $PINOT_HOST \
-brokerPort 8099 \
-query "SELECT COUNT(*) FROM airlineStats"
Results
[root@newsuper-2 pinot]# bin/pinot-admin.sh PostQuery \
> -brokerHost $PINOT_HOST \
> -brokerPort 8099 \
> -query "SELECT COUNT(*) FROM airlineStats"
2026/04/02 06:21:17.572 INFO [PostQueryCommand] [main] Executing command: PostQuery -brokerProtocol http -brokerHost newsuper-2.newsuper.harshith.svc.cluster.local -brokerPort 8099 -query SELECT COUNT(*) FROM airlineStats
2026/04/02 06:21:17.751 INFO [PostQueryCommand] [main] Result: {"resultTable":{"dataSchema":{"columnNames":["count(*)"],"columnDataTypes":["LONG"]},"rows":[[9746]]},"numRowsResultSet":1,"partialResult":false,"exceptions":[],"numGroupsLimitReached":false,"numGroupsWarningLimitReached":false,"timeUsedMs":131,"requestId":"299917538000000004","clientRequestId":null,"brokerId":"Broker_newsuper-2.newsuper.harshith.svc.cluster.local_8099","numDocsScanned":31,"totalDocs":9746,"numEntriesScannedInFilter":0,"numEntriesScannedPostFilter":31,"numServersQueried":1,"numServersResponded":1,"numSegmentsQueried":31,"numSegmentsProcessed":31,"numSegmentsMatched":31,"numConsumingSegmentsQueried":0,"numConsumingSegmentsProcessed":0,"numConsumingSegmentsMatched":0,"minConsumingFreshnessTimeMs":0,"numSegmentsPrunedByBroker":0,"numSegmentsPrunedByServer":0,"numSegmentsPrunedInvalid":0,"numSegmentsPrunedByLimit":0,"numSegmentsPrunedByValue":0,"brokerReduceTimeMs":6,"offlineThreadCpuTimeNs":0,"realtimeThreadCpuTimeNs":0,"offlineSystemActivitiesCpuTimeNs":0,"realtimeSystemActivitiesCpuTimeNs":0,"offlineResponseSerializationCpuTimeNs":0,"realtimeResponseSerializationCpuTimeNs":0,"offlineTotalCpuTimeNs":0,"realtimeTotalCpuTimeNs":0,"explainPlanNumEmptyFilterSegments":0,"explainPlanNumMatchAllFilterSegments":0,"traceInfo":{},"tablesQueried":["airlineStats"],"offlineThreadMemAllocatedBytes":0,"realtimeThreadMemAllocatedBytes":0,"offlineResponseSerMemAllocatedBytes":0,"realtimeResponseSerMemAllocatedBytes":0,"offlineTotalMemAllocatedBytes":0,"realtimeTotalMemAllocatedBytes":0,"pools":[-1],"rlsFiltersApplied":false,"groupsTrimmed":false}
[root@newsuper-2 pinot]#
Step 2: Connect Superset to Pinot
Add Database Connection
- In Superset, go to Settings → Database Connections
- Click + Database
- Select Apache Pinot (or "Other")
- Enter the SQLAlchemy URI:
# Generate connection string
echo "pinot://${PINOT_HOST}:8099/query/sql?controller=http%3A%2F%2F${PINOT_HOST}%3A9000"
Format:
pinot://<broker>:8099/query/sql?controller=http%3A%2F%2F<controller>%3A9000
Example:
pinot://newsuper-2.newsuper.harshith.svc.cluster.local:8099/query/sql?controller=http%3A%2F%2Fnewsuper-2.newsuper.harshith.svc.cluster.local%3A9000
- Click Test Connection → Connect
Create Dataset
- Go to Datasets → + Dataset
- Select your Pinot database
- Select schema: default
- Select table: airlineStats
- Click Create Dataset and Create Chart
Step 3: Query in Superset
SQL Lab Queries
Go to SQL Lab → SQL Editor:
Row count:
SELECT COUNT(*) as total_flights FROM airlineStats

Flights by carrier:
SELECT
Carrier,
COUNT(*) as flight_count,
AVG(ArrDelay) as avg_arrival_delay
FROM airlineStats
GROUP BY Carrier
ORDER BY flight_count DESC
LIMIT 20

Delays by day of week:
SELECT
DayOfWeek,
COUNT(*) as flights,
AVG(ArrDelay) as avg_delay
FROM airlineStats
GROUP BY DayOfWeek
ORDER BY DayOfWeek

Top routes:
SELECT
Origin,
Dest,
COUNT(*) as flight_count
FROM airlineStats
GROUP BY Origin, Dest
ORDER BY flight_count DESC
LIMIT 10
Create Charts
To create a chart: Datasets → click on airlineStats → Create Chart → select chart type.
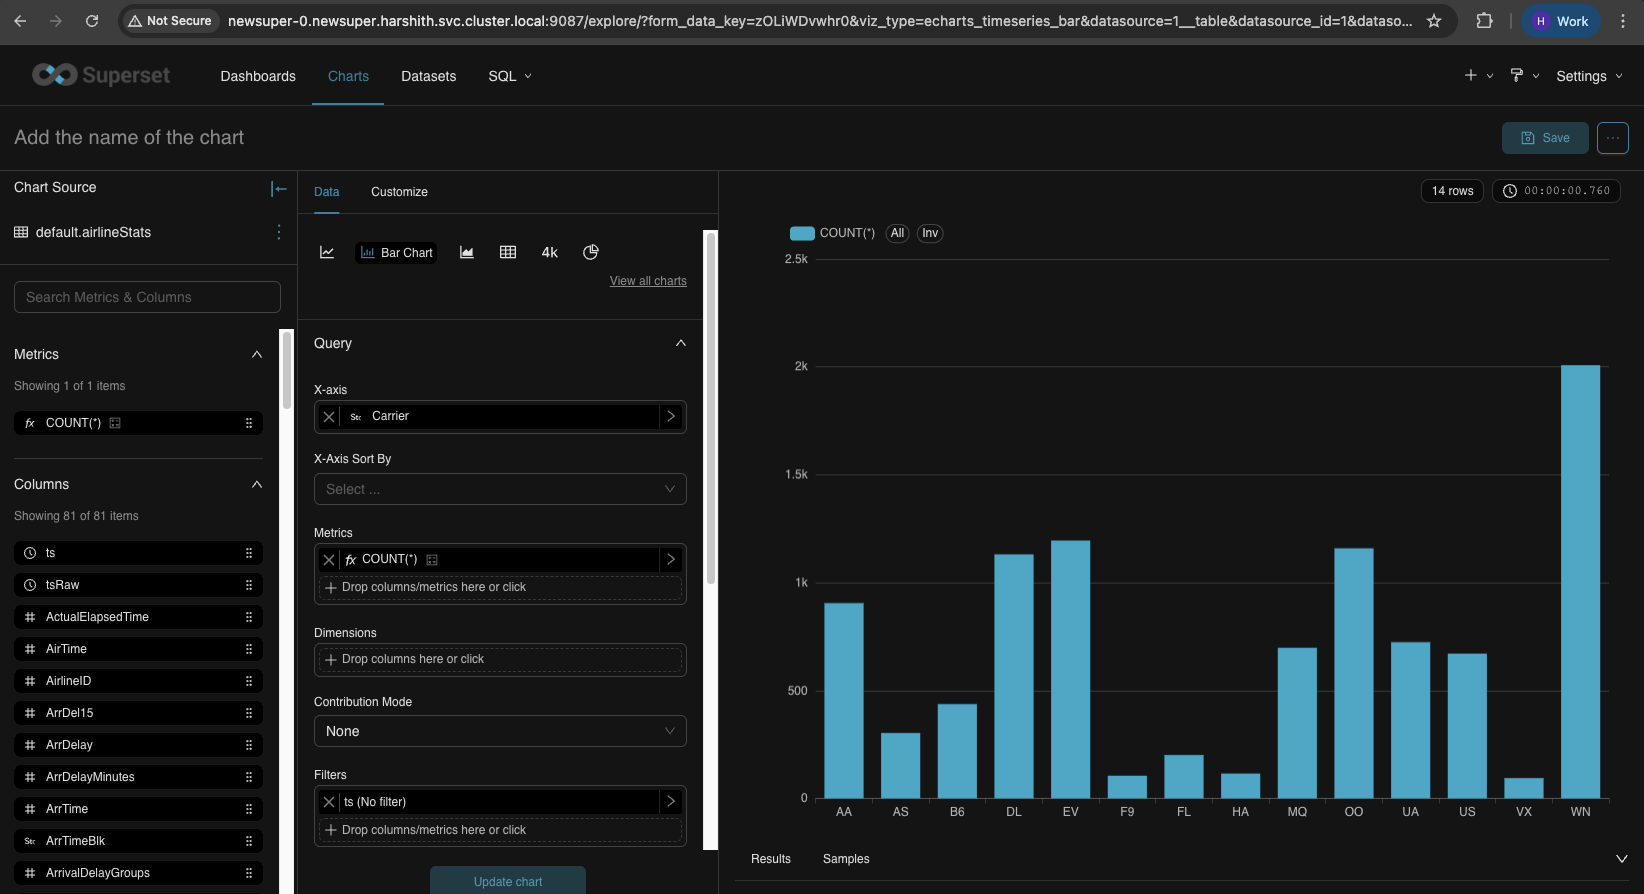
Bar Chart - Flights by Carrier
Field | Value | Description |
|---|---|---|
X-Axis | Carrier | Airline carrier codes (AA, UA, DL, etc.) shown on the horizontal axis |
Metrics | COUNT(*) | Number of flights (bar height) |
Dimensions | (leave empty) | Not needed for a simple bar chart |
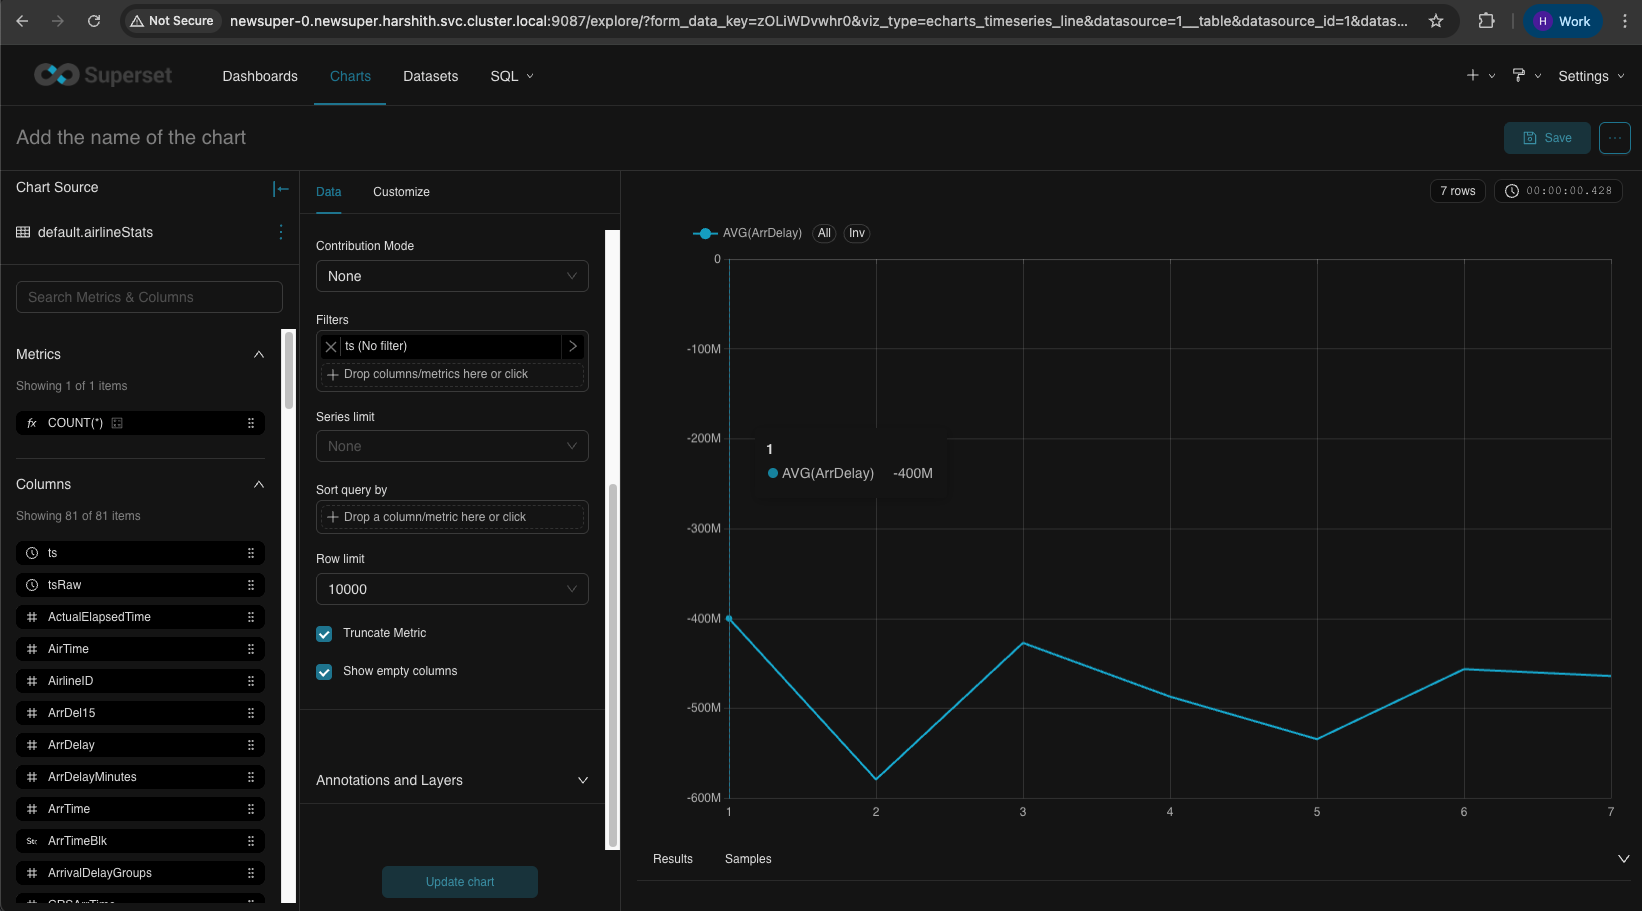
Line Chart - Average Delay by Day of Week
Field | Value | Description |
|---|---|---|
X-Axis | DayOfWeek | Day of week (1-7) shown on horizontal axis |
Metrics | AVG(ArrDelay) | Average arrival delay in minutes (line value) |
Dimensions | (leave empty) | Not needed for single line |
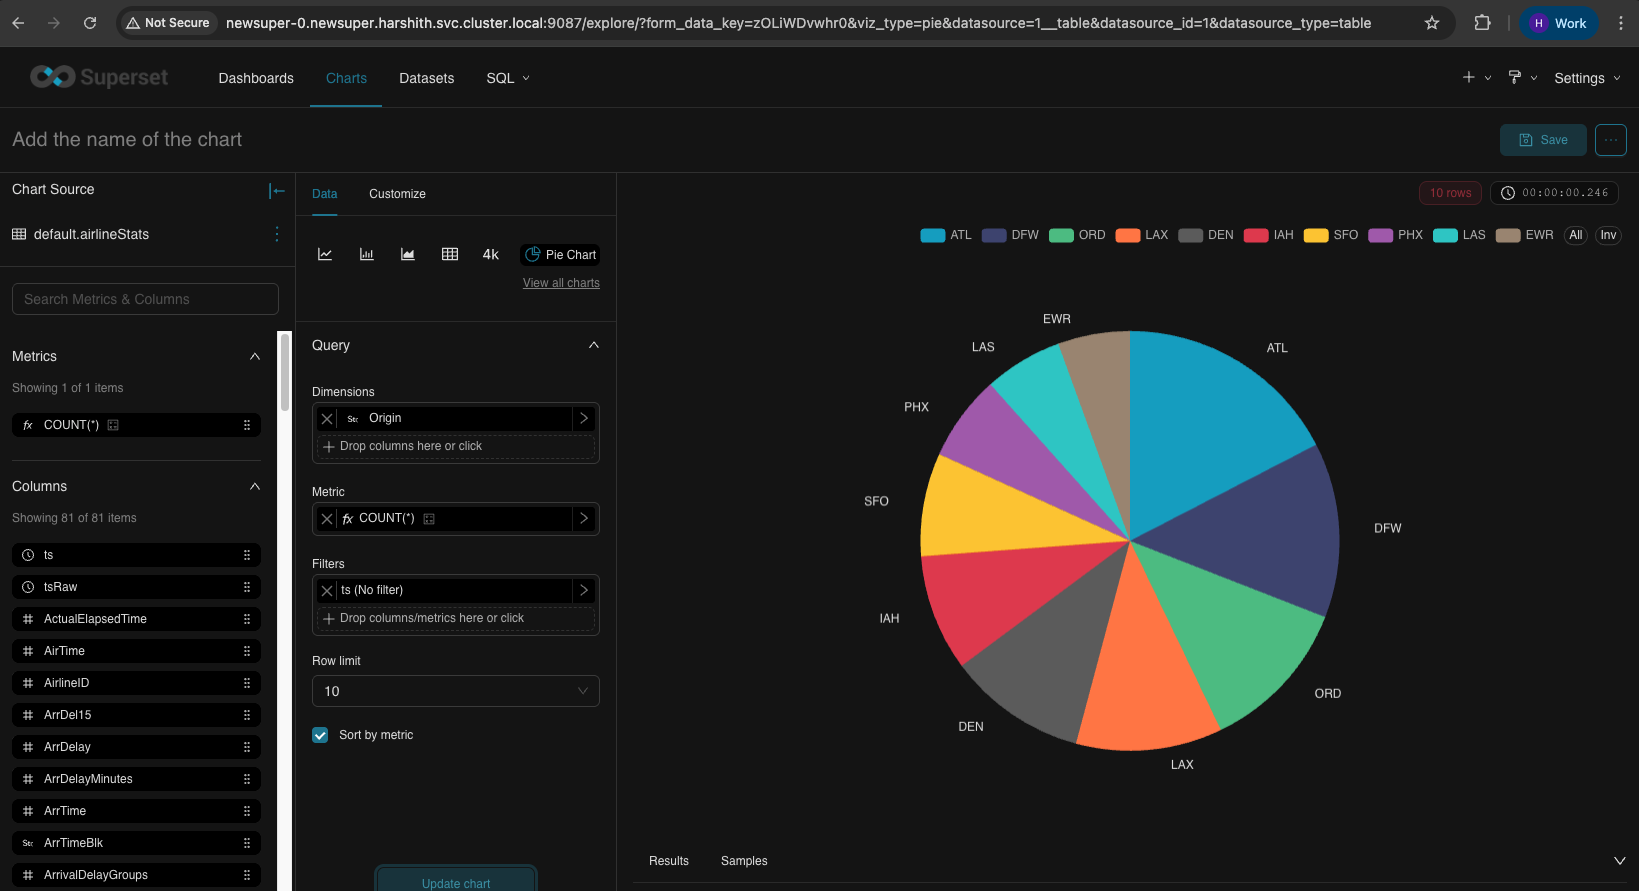
Pie Chart - Flights by Origin Airport
Field | Value | Description |
|---|---|---|
X-Axis | (not used) | Pie charts don't use X-axis |
Metrics | COUNT(*) | Number of flights (slice size) |
Dimensions | Origin | Airport codes - each slice represents an origin airport |
Row Limit | 10 | Show top 10 airports only |
Info
Don't put the same column in both X-Axis and Dimensions - this causes a "Duplicate column/metric labels" error.
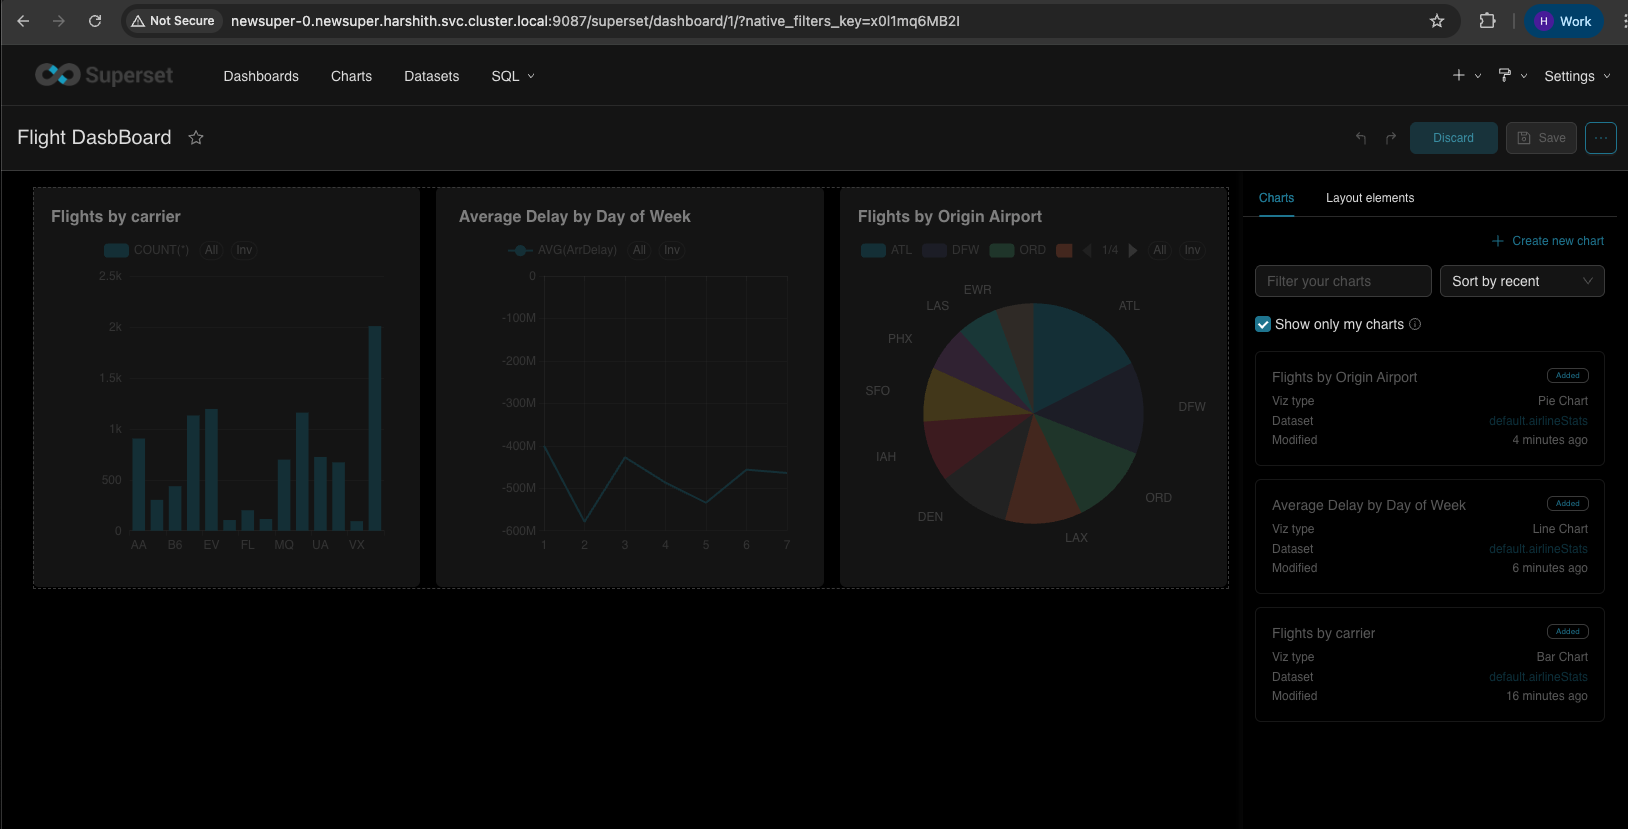
Create DashBoards
Hit Dashboards on the top bar and create a new dashboard, import charts (which we just created ) as shown by drag and drop, give it a name on the top left, and save.
Optionally, you can publish a chart
- appears in the Charts list
- can be added to dashboards
- can be shared with others
- persists in Superset DB
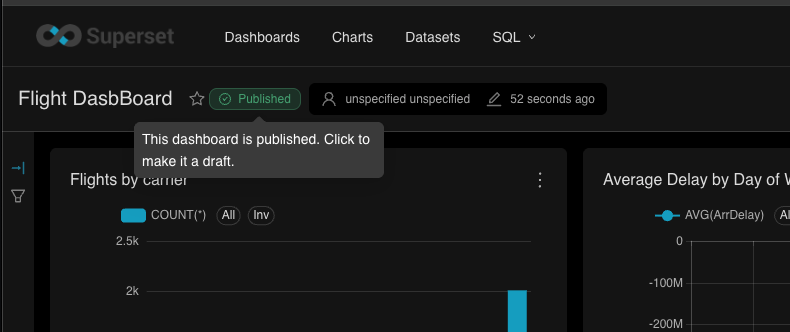
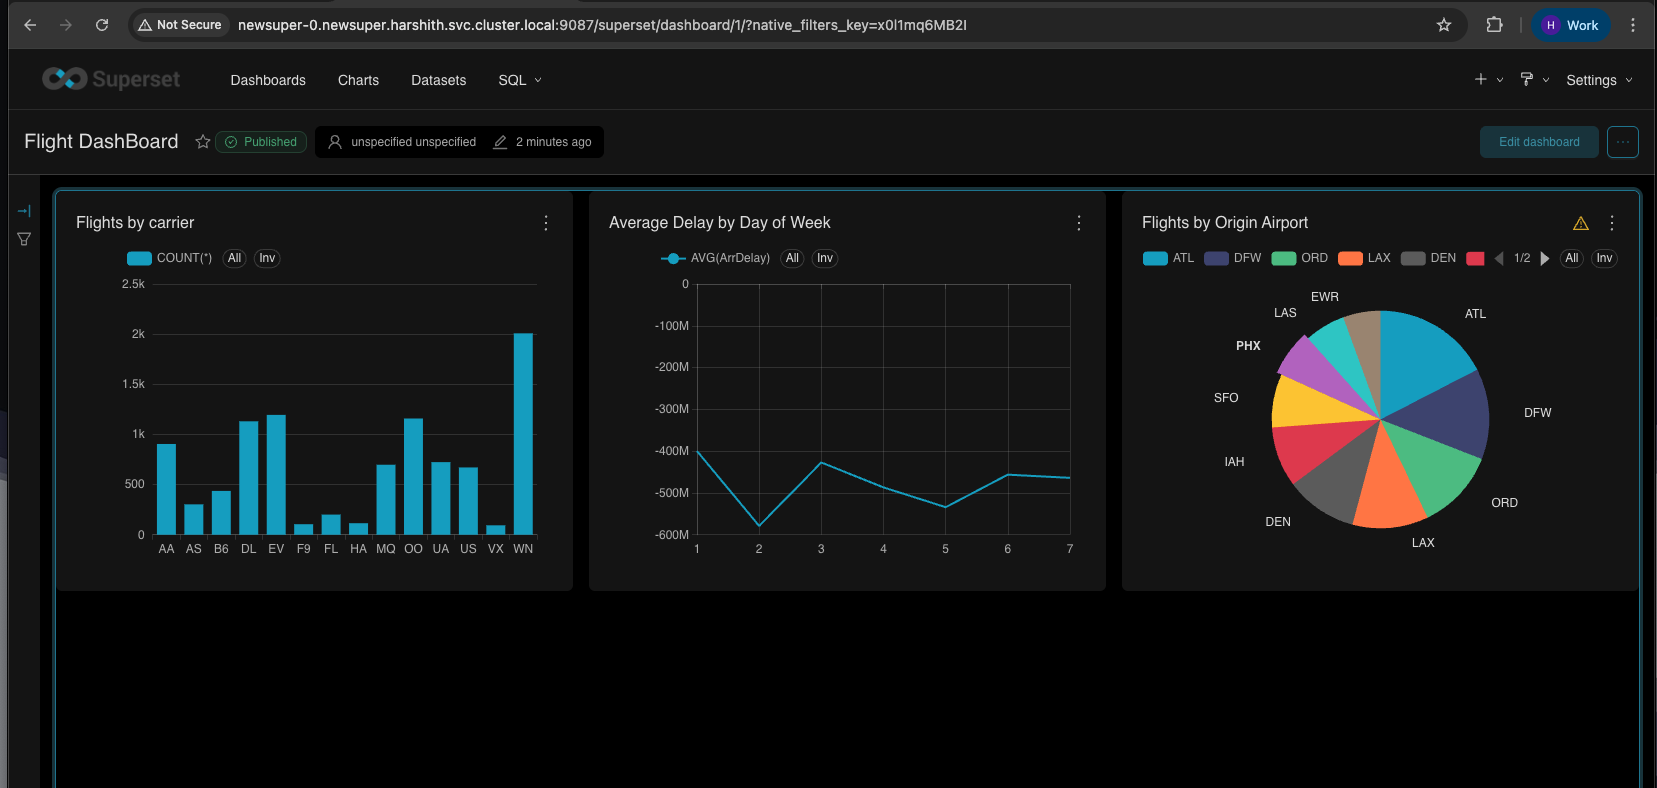
You can download dashboards or individual charts by clicking the 3-dot menu on the top right.
Quick Reference
Connection String
export PINOT_HOST=$(hostname -f)
echo "pinot://${PINOT_HOST}:8099/query/sql?controller=http%3A%2F%2F${PINOT_HOST}%3A9000"
Pinot SQL Notes
- Supported: SELECT, GROUP BY, ORDER BY, LIMIT, aggregations
- Not supported: JOIN, subqueries, window functions
Health Checks
curl http://$PINOT_HOST:9000/health # Controller
curl http://$PINOT_HOST:8099/health # Broker