
Monitor Pulse Server on Kubernetes
You can monitor Pulse services deployed on Kubernetes using the Admin UI.
This provides real-time visibility into Pulse application health and logs.
This view helps administrators:
- Monitor Pulse server health
- Troubleshoot runtime issues
- Analyze authentication, API, and service errors
- Validate deployments and restarts
Steps
- In the Admin UI, click the configured cluster.
- Click any Core or Add-on service.
The following details are displayed.
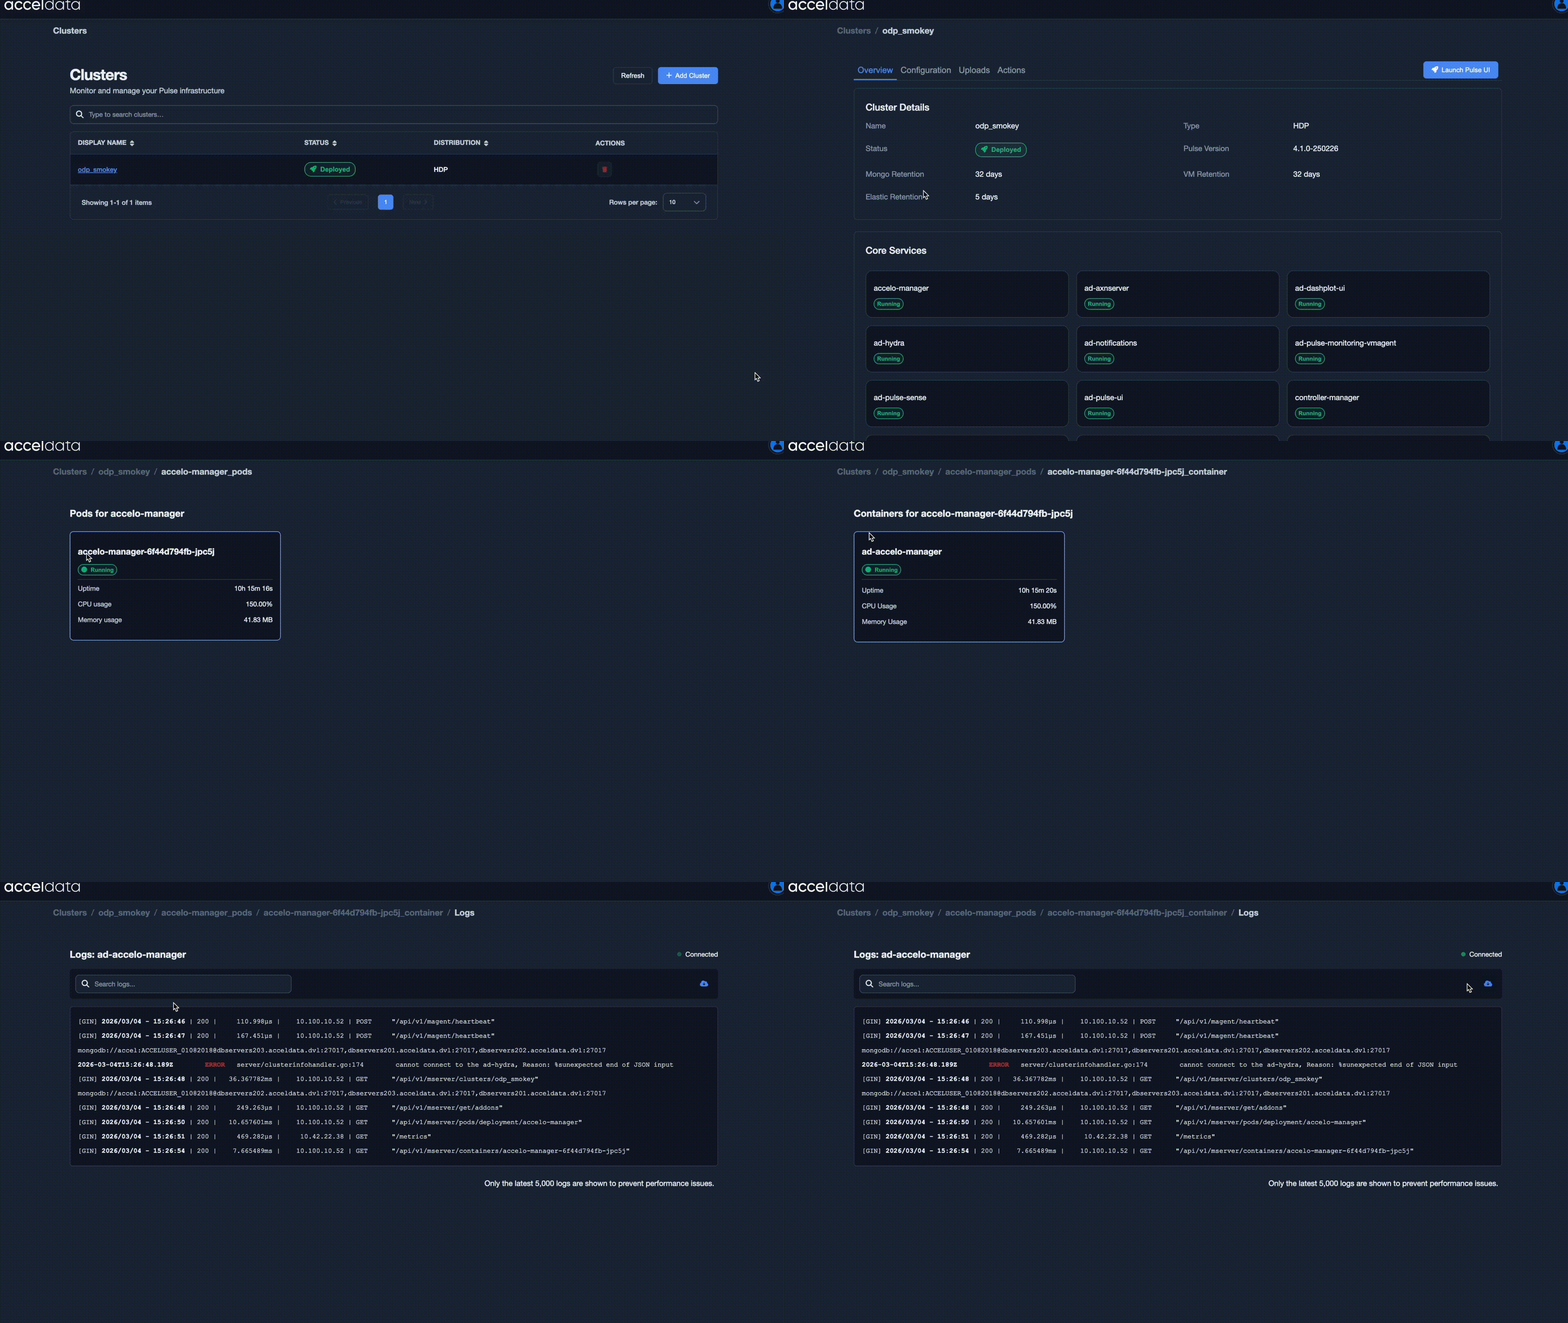
PODs
Lists all Pulse-related pods running in the selected cluster.
Pod Information includes:
- Pod Name – Unique name assigned to the Pulse pod
- Example: ad-pulse-ui-576766755b-pvs2c
- Uptime – Duration the pod has been running
- CPU Usage – Current CPU consumption of the pod
- Memory Usage – Current memory consumption of the pod
Containers
Each Pulse pod may contain one or more containers.
Container Information includes:
- Container Name – Name of the Pulse service container Example: ad-pulse-ui
- Uptime – How long the container has been running
- CPU Usage – CPU consumption percentage
- Memory Usage – Memory usage in MB
Logs
The Logs view provides real-time log streaming for the selected Pulse container.
Available options:
- Connected – Indicates that live log streaming is active
- Search logs – Filter logs using keywords
- Download: Download the logs.
Info
You can only see the logs up to 5000 from the time you are viewing them.