
Investigate Incidents
The Incident Details page provides comprehensive information, including the reason for raising the incident, the number of occurrences, its current status, severity level, timestamps for when it was raised and last updated, the execution interval, and other critical metrics. This detailed view helps you diagnose and pinpoint the root cause of the issue for faster resolution, while Acceldata Pulse provides actionable recommendations to effectively mitigate the incident and expedite the resolution process.
- Log in to the Pulse UI and navigate to Incidents from the left side. All the Incidents are listed and categorized based on severity levels such as Critical, High, Medium, and Low.
- (Or) Navigate to the Pulse UI Home page and click Incident Analytics. The Incident page appears with details on the screen.
- Specify the name of an incident in the search bar or filter as needed. All the incidents related to it are displayed on the incidents page.
- Click the incident name from the incidents panel to view its details on the right side. On the incident details tab, you can see the following information about an incident.
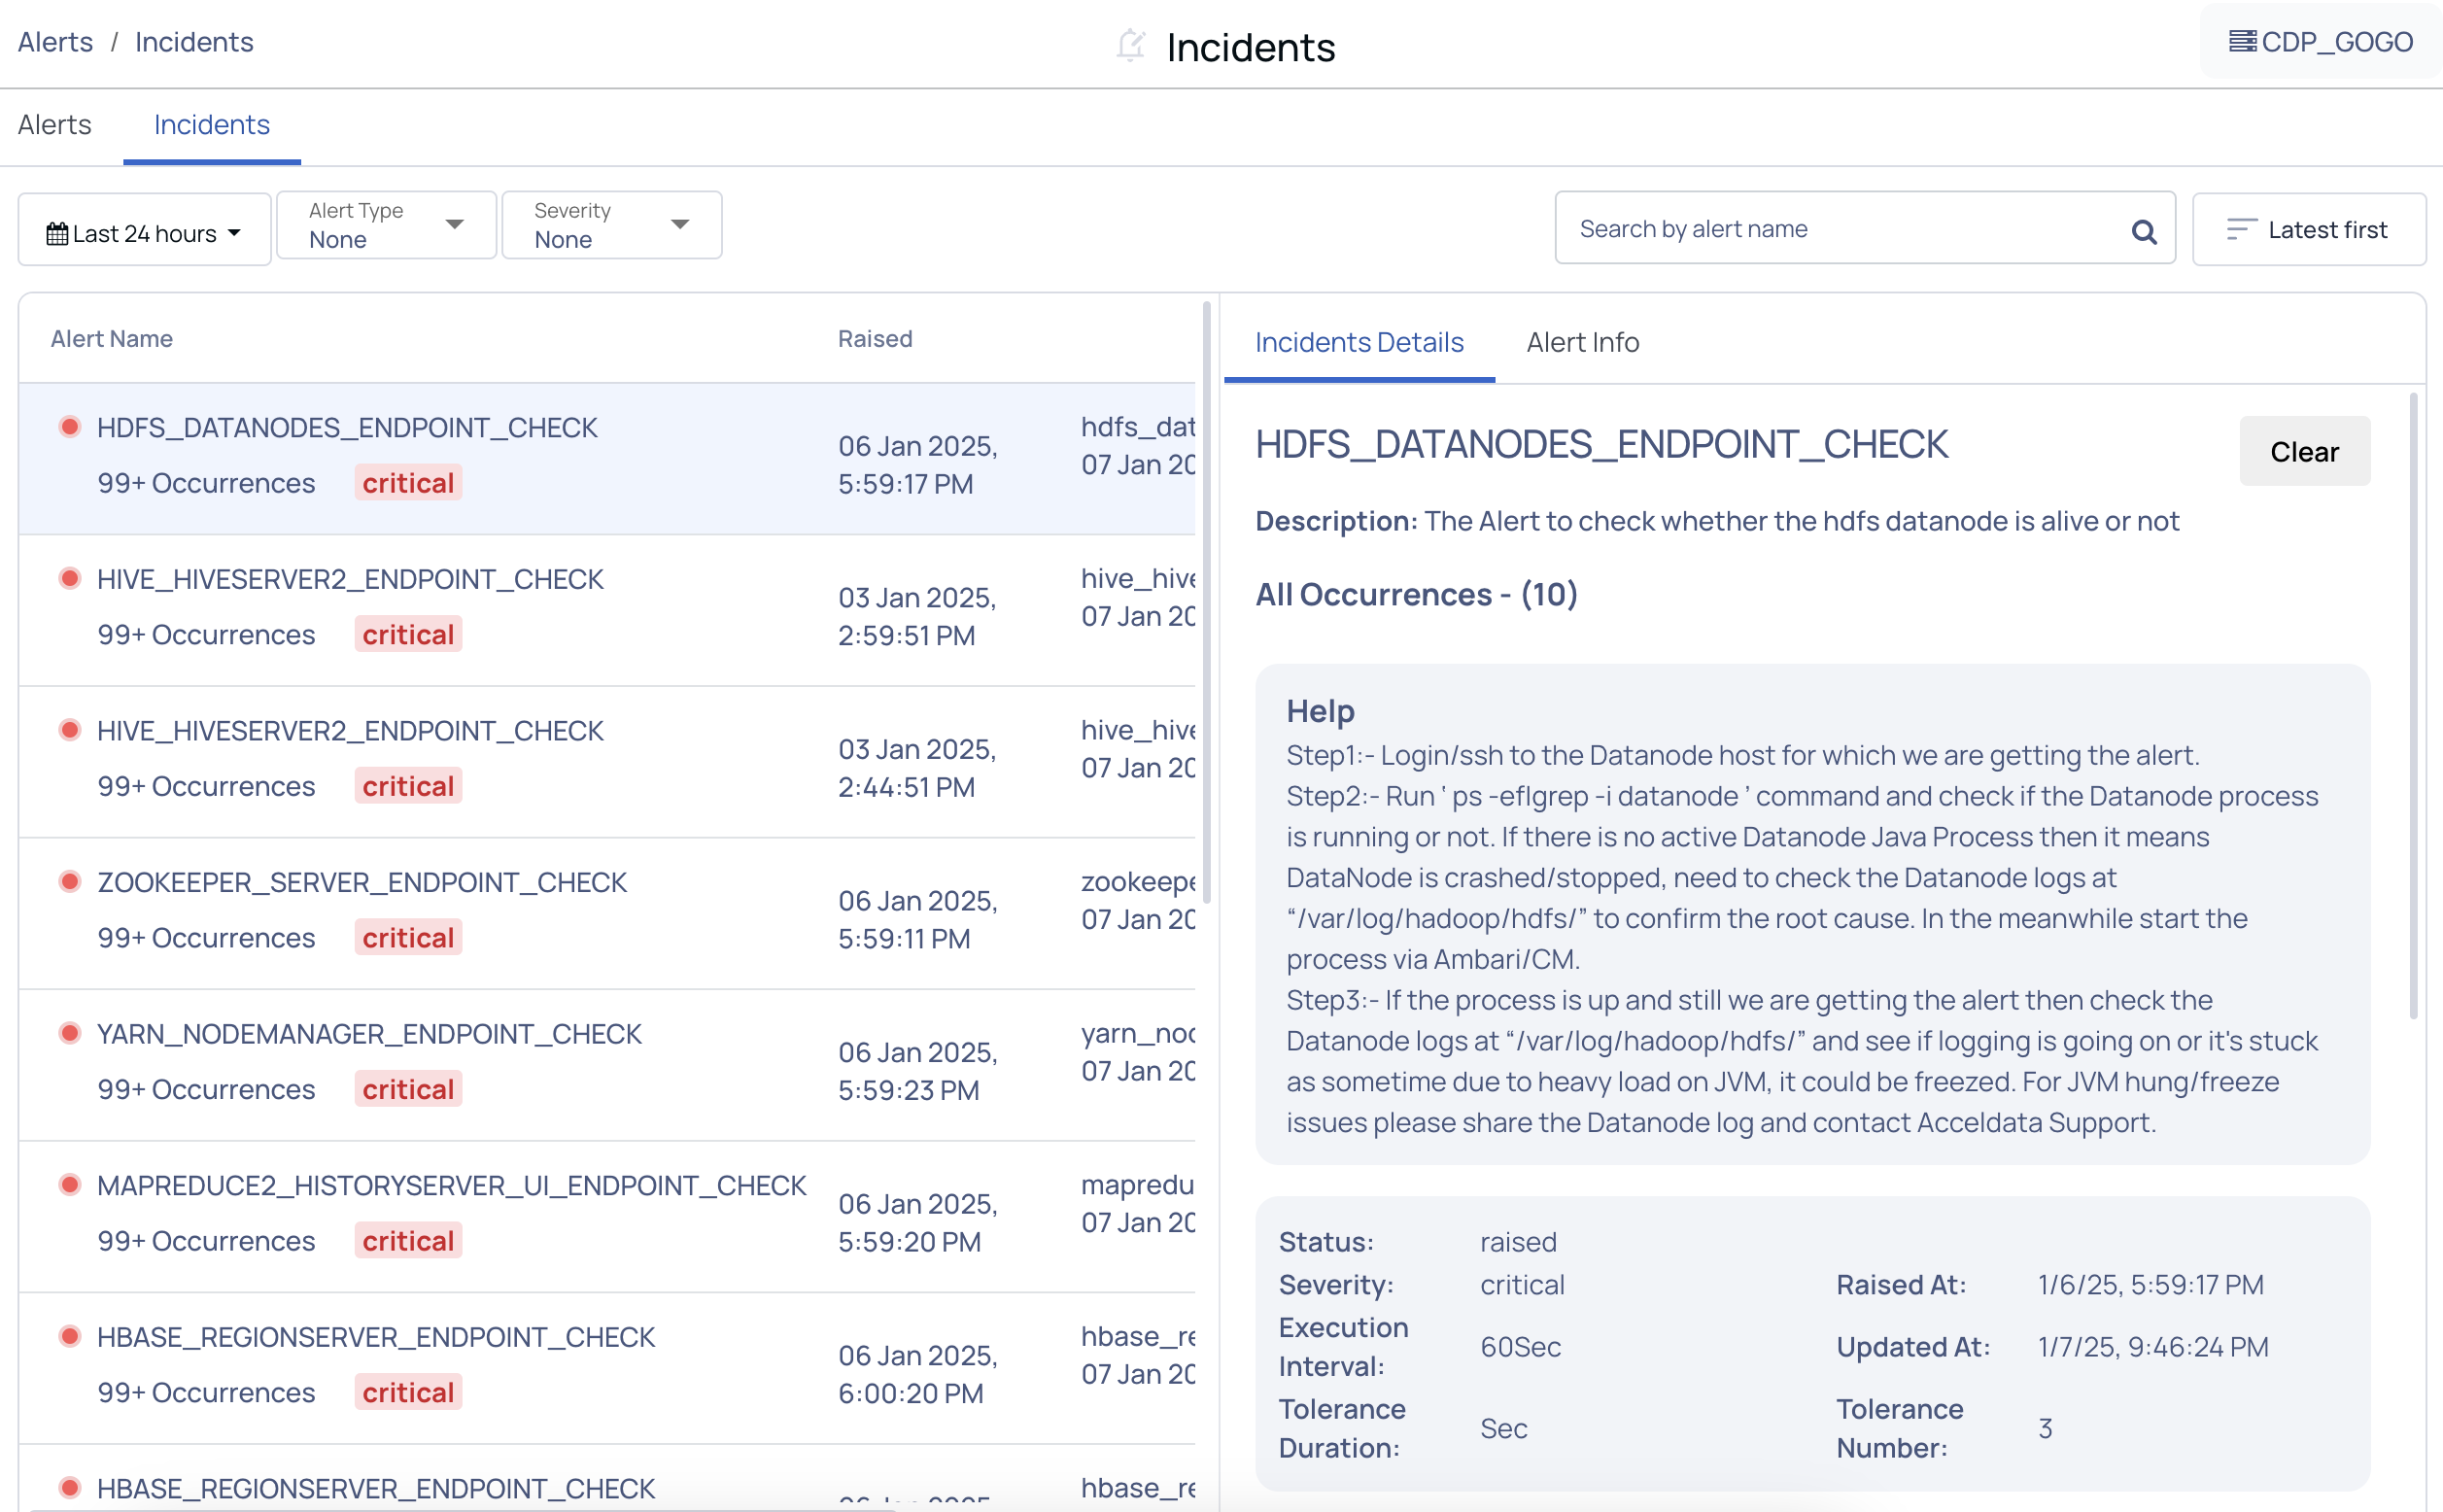
Option | Description |
|---|---|
Description | Explains the reason for triggering an incident. |
Help | Provides context for troubleshooting. |
Occurrence | Shows how many times the incident has happened |
Status | Displays the current state of the incident (for example, Raised, Closed, etc.) |
Severity | An impact the incident makes on the ecosystem. Indicates the impact level of the incident on the Hadoop ecosystem, helping prioritize resolutions. |
Execution Interval | Shows how often the system checks for the incident condition. |
Tolerance Duration | Specifies the allowable time a condition can persist before raising an incident. |
Tolerance Number | Indicates the maximum number of allowable occurrences before an incident is triggered. |
Raised at | Records the exact date and time the incident was first detected. |
Updated at | Shows the most recent date and time the incident details were updated. |
View Incident data | The detailed incident data shows the host, service name, response code, and the error message (For example, "Connection refused"). |
Important
The Incident Details tab shows each occurrence of the alert that led to the creation of an incident.
- Click the Alert tab to view the alert details for which the incident was created.