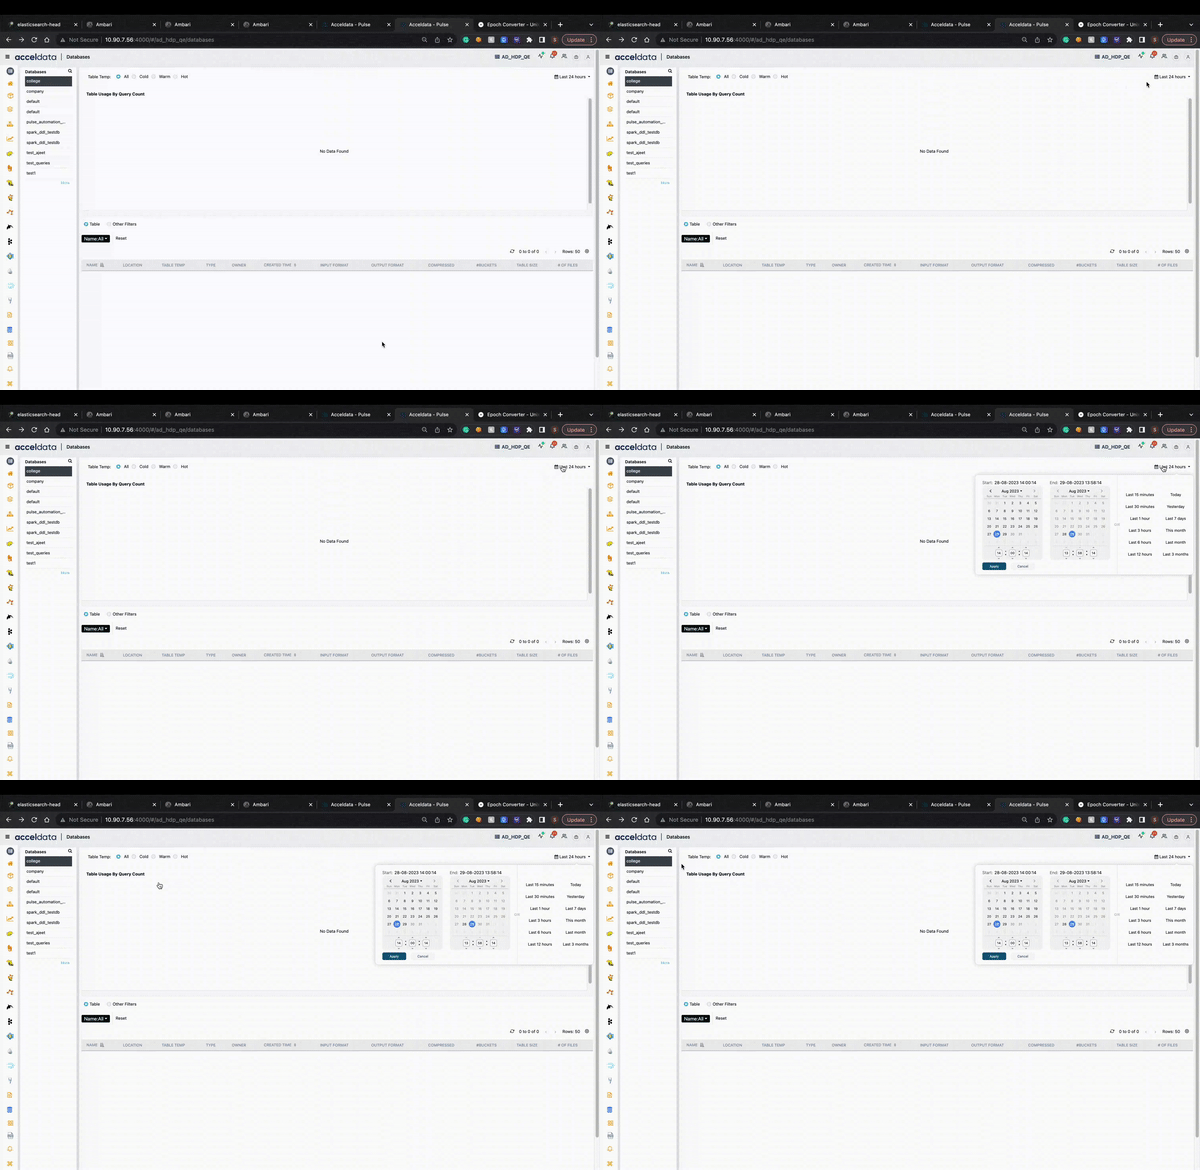
Databases Table Details
The Database Table Details page displays the table details such as table usage and column details for a particular table.
Summary Panel
The following table provides description of the details displayed in the Summary panel:
Column Name | Description |
|---|---|
Type | Displays the type of data stored inside the database. The following are the types: Managed table External table |
Name | Name of the table. |
Created Time | Displays the date and time when the table was created. |
Output Format | Displays the output format of the table. |
Input Format | Displays the input format of the table. |
Compressed | States if a table is compressed by displaying either True if compressed or False if not compressed. |
#Buckets | The number of buckets used for data partitioning. |
Location | Displays the name of the table. Click on the name to view location details of the table in the HDFS File Explorer page. |
Database | The name of the Database to which the table belongs to. |
# Columns | The number of columns in the table. |
# Partitions | The number of partitions on the table. |
# Delta Files | The number of delta files on the table. |
Table Usage
The heat map chart displays the table's usage up to the last 180 days. The Hive Queries box displays the number of hive queries that correspond to the number of days. By default, the data is displayed for the last 7 days. To change the number of days, click on Last 7 days and select the number of days from the drop-down list.
Column Details
The following table provides description of the details displayed in the Column Details table:
Field Name | Description |
|---|---|
Column Name | Name of the table column. |
Type Name | Displays the type of the column. |
Output Format | Displays the output format of the table. |
Input Format | Displays the input format of the table. |
Compressed | States if a table is compressed by displaying either True if compressed or False if not compressed. |
Usage Count | Displays the number of times a column was used across all the queries. |
Hive Locks
The Hive Locks section displays real time information about the locks applied on a Table. You can now view information like Shared and exclusive locks applied, lock ID, Lock type, user who applied the lock and so on. When you click Refresh, the latest information is retrieved. You must set the SHOW HIVE LOCKS environment variable to true in graphql to enable this feature.