
Application Explorer
The Applications Explorer board displays the status of applications that run on YARN. You can do the following using this dashboard.
- View inconsistent applications or incidents.
- View recommendations for faulty apps.
Filtering Option
In Applications Explorer, click any filter and choose a criteria to display the results. You can filter applications by the following criteria.
Filter | Description |
|---|---|
Queues | The list of queues used in YARN. |
App Type | The type of application submitted to YARN for execution. |
Status | The status of the job. |
Users | The user executing the job in the application. |
Search Option
Perform the following steps to search for a record in the Applications Explorer.
- Select a search parameter. Pulse provides you multiple search parameters.
- Select a suitable operator for your parameter.
- Enter the search term and click the enter key.
Alternate Search Option
To enable the alternate search option, contact support@acceldata.io.
To search a record using this feature, perform the following:
- After enabling this search option, click the search box at the top of the data table. Automatic suggestions appear. You may now paste the fields such as column name, operator, value, or unit and click , the filter will be applied instantly and you will see the search results. You may also press after entering a field. Use to add further values and filter.
- (Optional) To navigate through the drop-down menu, use the up and down arrow keys, and then use the enter key to select from it.
- Select the type of filter you want to apply from the drop-down menu. You can add multiple filters.
- To remove a filter, click .
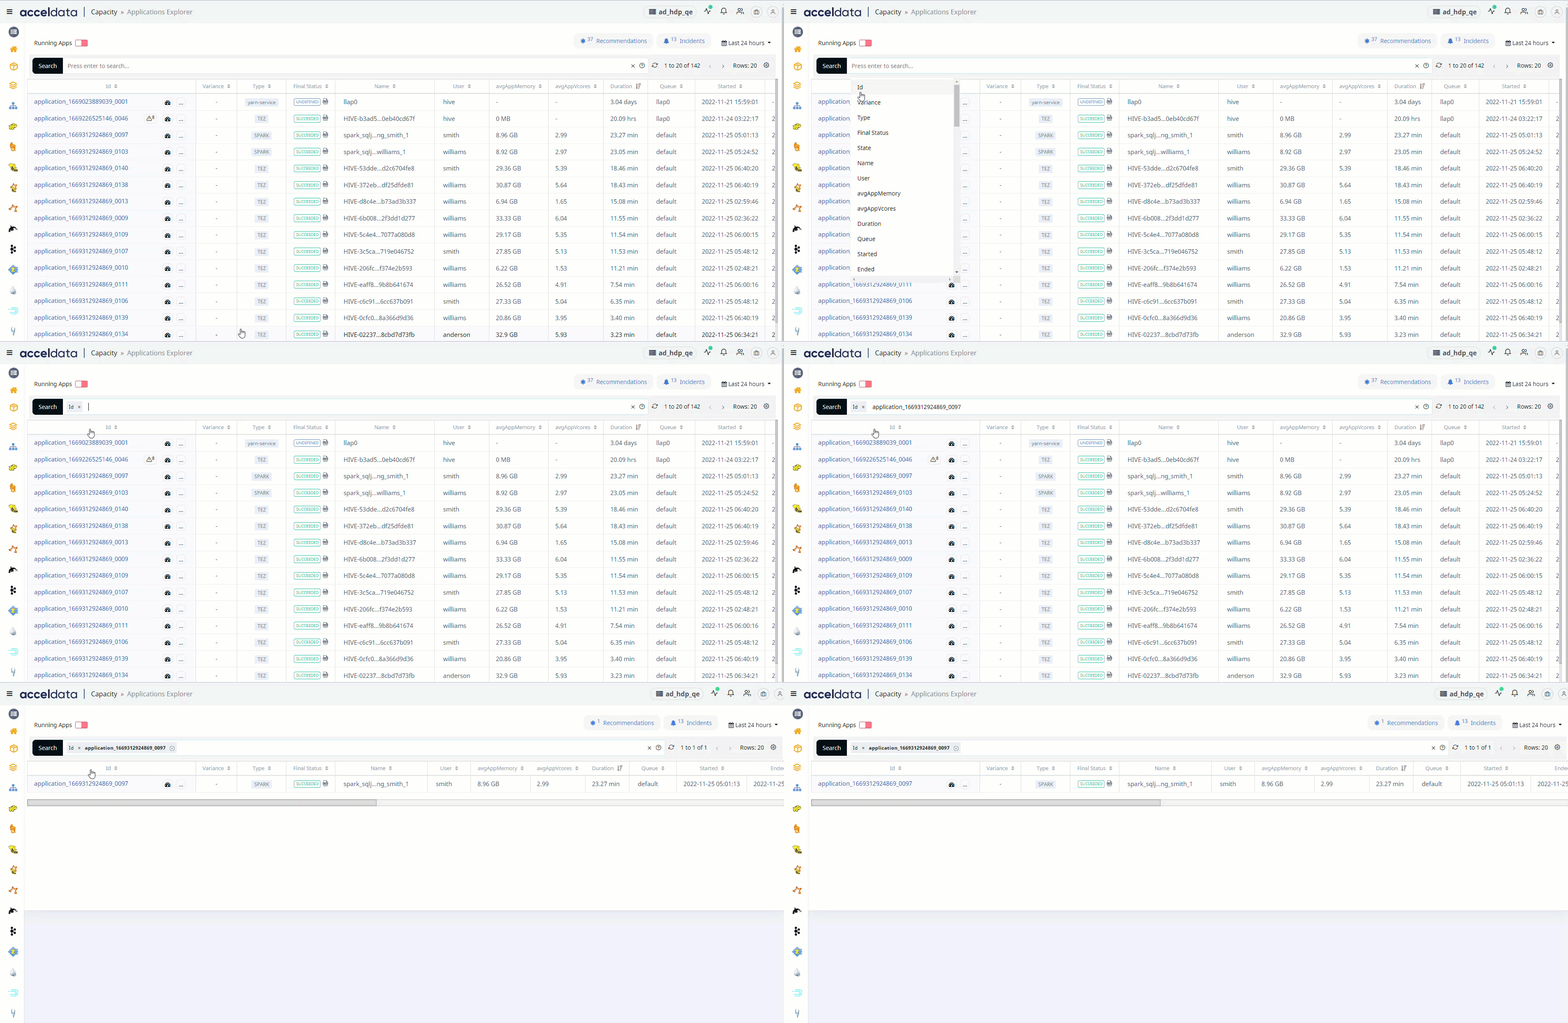
To search for a start or end date, the date must be entered in the same format (YYYY-MM-DD HH:MIN:SEC) as displayed in the column.
For String Data type fields, you can use the =~ operator. This operator allows you to search strings by entering partial string.
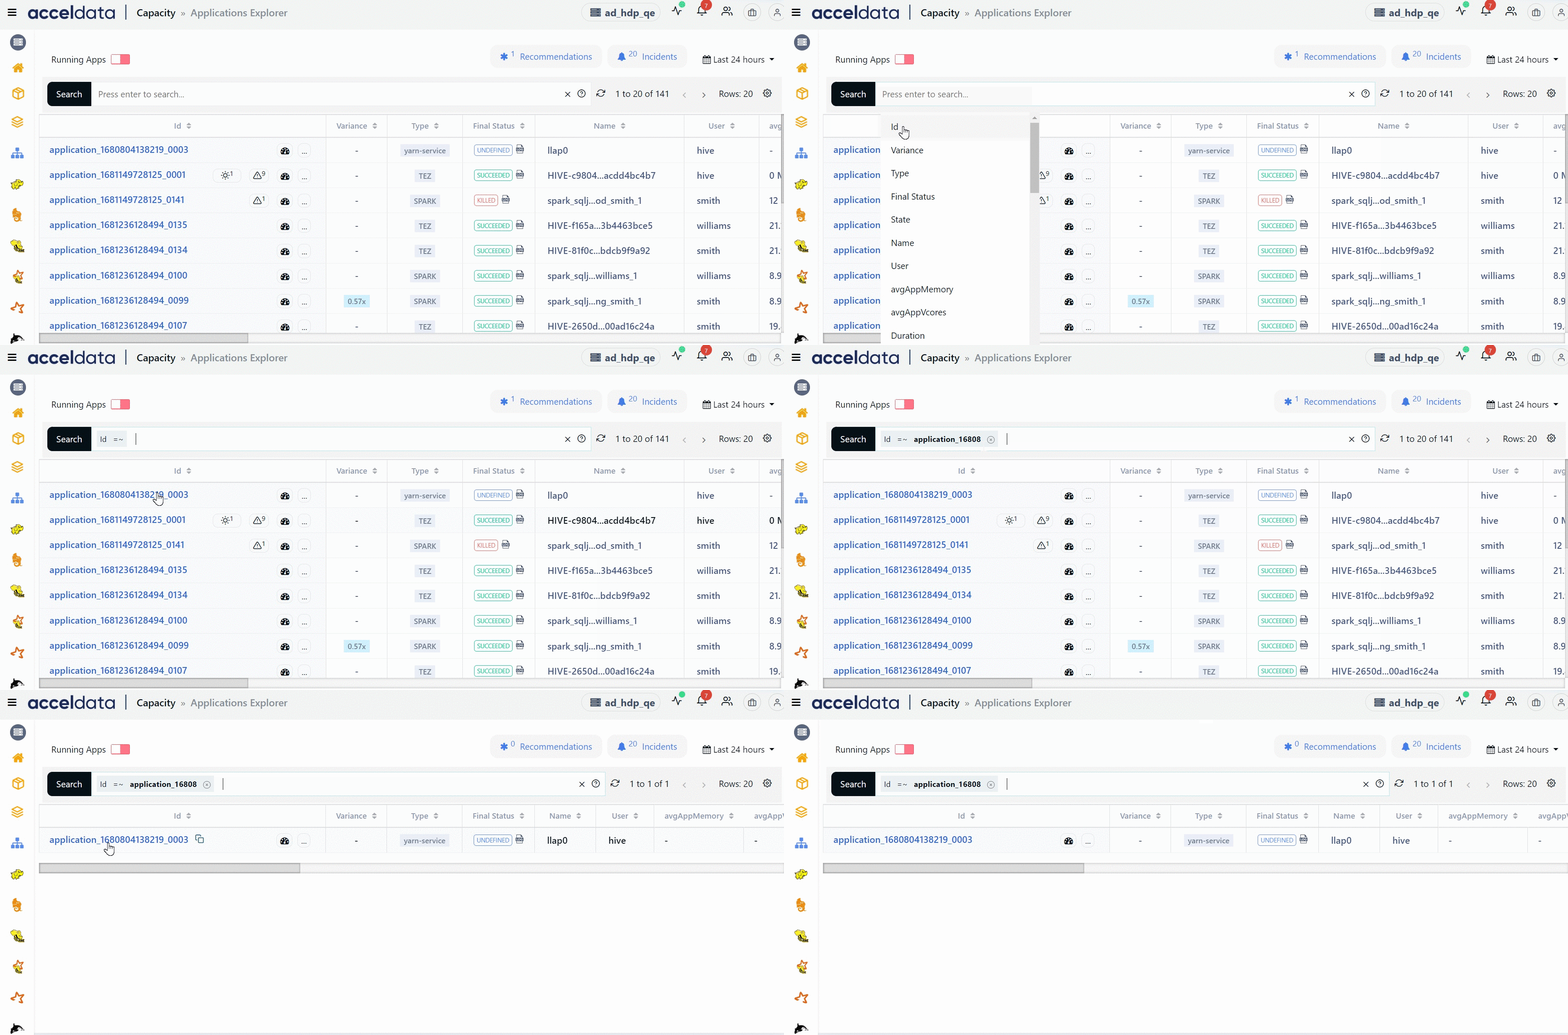
You can also use regular expressions to view all the items that match your regular expression.
Viewing Details
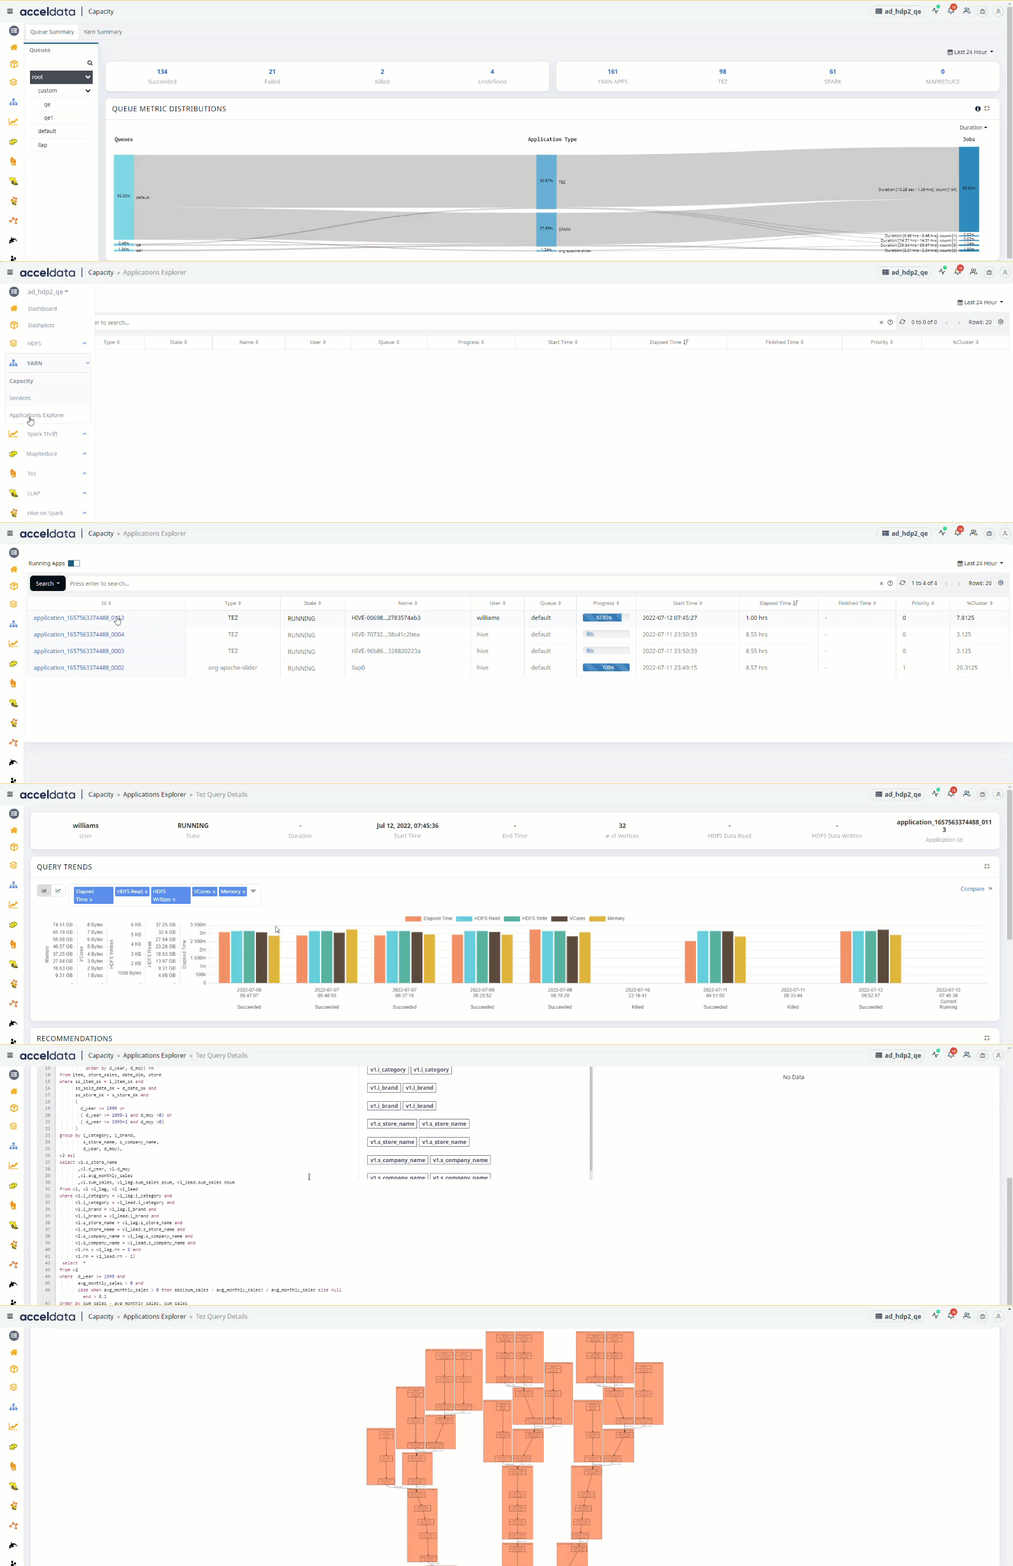
You may now view the specifics of the running applications by clicking on their IDs.
Recommendations
For jobs of every application type you submit, you can view recommendations to optimize the performance of your jobs. These recommendations are based on jobs submitted by applications in the YARN queue of your Hadoop cluster.
Viewing Recommendations
To view recommendations for optimization of jobs, do the following.
- Click Recommendations button in the top. A Recommendations tile is displayed. The recommendation is displayed in the following format. Number of applications, potential problem category. For example, 2 Apps, High memory status means that two applications might have high memory issues.
- In the Recommendations tile, click the recommendations for the problem category you want to view. The IDs of applications that have recommendations in that category are displayed.
- Click the application ID in the table to view the recommendation.
Viewing Incidents
To view incidents in the application explorer, do the following.
- Click Incidents button in the top. An Incidents tile is displayed. The incident is displayed in the following format: Number of incidents, service name whose incident was reported, View incidents link. For example, 2 Incidents, Hadoop Service, View Incidents status means that two incidents were raised by Hadoop service.
- Click View incidents to know more. The Incidents window is displayed.
Incidents
The Incidents page displays the list of incidents raised by a service. Each incident is displayed in the following format.
(Incident name ) (Time start time and end time of the incident) (The host on which the incident was raised) (Severity of the incident) (Status of the incident, whether cleared or raised)
The following image is an example of the incident format.

Viewing Incident Details
To view incident details, click the incident name to expand the details.
A Details and Alert tab are displayed.
- The Details tab displays all details of the incident.
- The Alert tab lets you edit the alert raised by the incident. Click the Edit button to edit the fields of the alert.
- From the incident details window you can also do the following to view the date and time at which the incident was raised and evaluated.
- Click Raised at to expand detailed information of the date and time at which the incident raised.
- Click Evaluated at to expand detailed information of the incident evaluation.
Metrics
By default, the table in the dashboard allows you to view the following metrics of jobs carried out by applications installed in YARN.
Metric | Description |
|---|---|
ID | The ID of the application. |
Variance | The value that displays by how many times the application is running slow. |
Type | The type of application. |
Final Status | The status of the application when the associated job completed execution. The final status can be either of the following. Succeeded, Failed, Killed, Undefined, Unknown. |
Name | The name of the job. |
User | The name of the user executing the job. |
Memory | The amount of memory consumed by the job. |
vCores | The amount of vCores used by the application. |
Duration | The time consumed to complete the job. |
Queue | The name of the queue the application resides in. |
Started | The time at which the job in the application started. |
Ended | The time at which the job in the application ended. |
cpuUsePercent | The amount of CPU used (in %) by the application. |
avgCore | The average number of cores used. |
avgMemoryMb | The average amount of memory used (in MB). |
maxMemoryMb | The maximum amount of memory used (in MB). |
memoryUsePercent | The amount of memory used (in %). |
containers | The number of containers used by the application. |
hosts | The list of hosts the application executed jobs on. |
memoryMbSec | The rate of memory utilization. |
coresSec | The rate of core utilization. |
totalTime | The total time taken to execute the job. |
The metrics table might display the following icons for a record. Click these icons to know more.
- The alert button displays the service(s) of the application that might require attention.
- The tachometer button displays more details of the selected application ID.
- The three horizontal dots button displays the following options.
Add to Compare: Compares any two jobs to list the configuration difference. Choose this option for any two jobs in the table that you want to compare.
View Concurrency: Displays the list of jobs that were running at the same time as the selected application ID.
Viewing Logs
For every record, you can view the status log. To view the logs, as shown in the screenshot below, click the ID's in the Id column of the record whose log you want to view.

Adding/Removing Columns
To add or remove a column to the Applications Explorer table, perform the following:
- In the top right column of the table, click the table settings icon. A Select Column window appears.
- From the available list of columns, select the column name you want to add to the table or deselect a column name you want to remove from the table.
- Click Apply. The table is modified.