
Analyze Application-Level Metrics
Pulse displays application or YARN workload (Jobs and Queries) metrics to help you monitor workloads, optimize resource usage, and troubleshoot performance issues.
Steps
- Access Application Explorer
- In the Pulse UI, select YARN from the left navigation bar > Application Explorer.
- Or, go to Pulse Home and click YARN Workloads Overview.
- On the Application Explorer page, set the following.
- On the Application Explorer page, set the time range
- Choose Today, Last 12 Hours, Last 3 Months, or define a custom period.
- Click Apply to view results within the selected time frame.
- Enable or Disable RM Live View
- Enabled (default): Shows a real-time streaming view from the YARN ResourceManager. Only current resource usage is displayed; completed jobs are not shown.
- Disable: Displays all workloads and jobs, including completed ones, using historical metrics stored in the cluster.
- Filter by Container Runtime. This is available only on the Enabled RM Live View.
- Narrow results based on runtime (for example, >30 min, 1 hr, 2 hr, 4 hr).
- Helps identify long-running jobs and optimize resource usage.
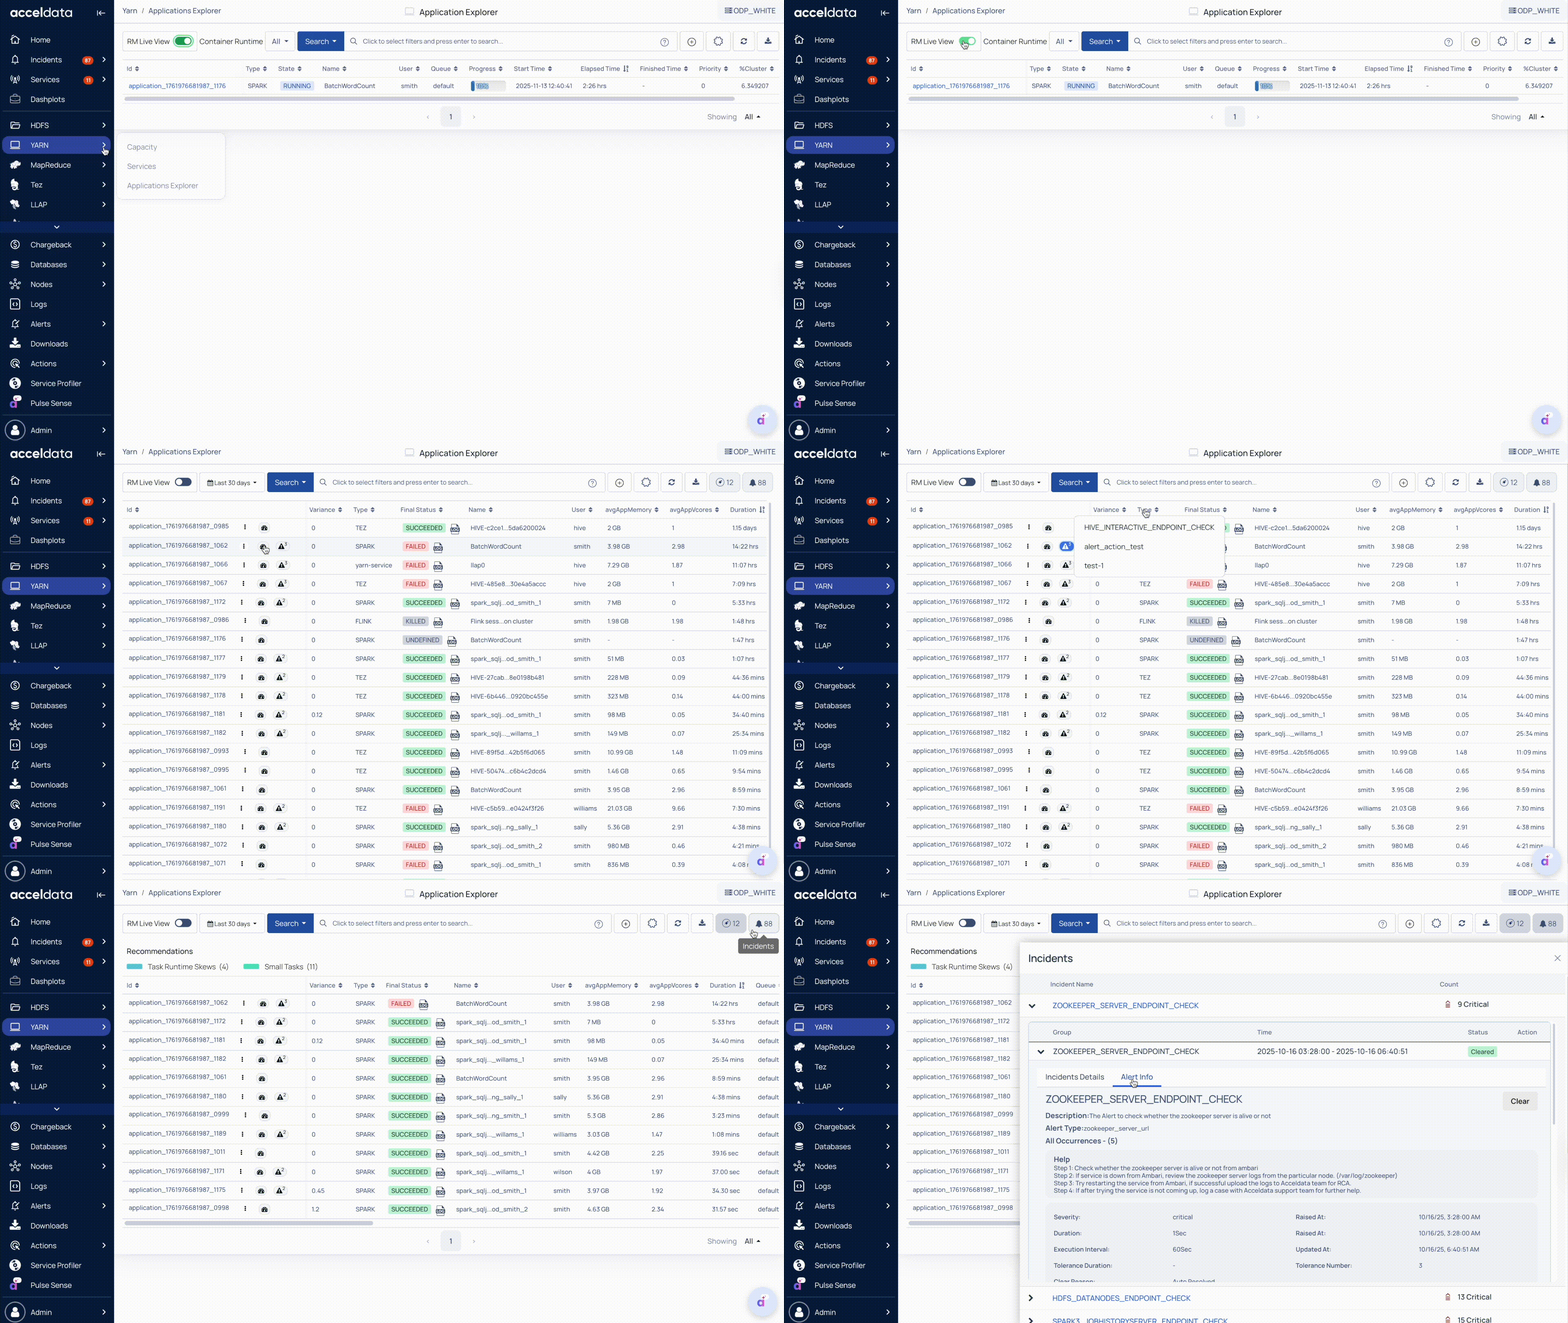
Application Metrics
Application Identification
- ID / Name / Type – Track specific applications and jobs, and differentiate job types.
- User – Identify the job owner for accountability and resource tracking.
Application Status and Duration
- Final Status – View job completion states: Succeeded, Failed, Killed, Undefined, Unknown. Helps you quickly identify failures. Click the Logs icon to check the specific application logs.
- Start / End / Duration / Total Time – Monitor job timelines and execution efficiency.
Resource Usage
- avgAppMemory / maxAppMemory – Memory consumed by the job; helps detect over- or under-utilization.
- avgAppVcores / maxContainerCore – CPU cores allocated and used; helps optimize cluster CPU usage.
- CPU / Memory % – Percent utilization; helps spot resource bottlenecks.
- memoryMbSec / coresSec – Memory and CPU utilization rates; useful for trend analysis and optimization.
Workload Distribution
- Containers – Number of YARN containers used; helps monitor parallel processing and workload distribution.
- Hosts – Nodes running the job; shows where workloads are executing.
- Queue – YARN queue name; helps track job placement and priority in the cluster.
For more details about the application-level metrics, see Application Metrics.
Action Icons
Action icons appear next to the Application ID in Pulse.
- Three-dots menu: Provides options, including:
- View Concurrency: Check applications (jobs or queries) running at the same time.
- Add to Compare: Compare the performance data of two or more applications.
- For details, see Analyze Concurrency and Compare Data.
- Tachometer icon: Opens metrics for Queue Availability, Concurrent Applications, and Container Availability. For details, see Visualize Application Resources.
- Alert icon: Indicates services that require attention. For details, see Track Application Incidents and Alerts.
Check Application Details
Click an Application ID in the table to view the detailed job/query analysis. For example, details about the Spark job, Hive query, etc., navigate to their respective service-level documentation.