Reports
You can create reports on Visualization or Dashboards. Once you add and configure a report on the dashboard or visualizations, you can schedule the frequency at which you wish to receive Reports as Emails. You can create multiple reports on Dashboards and Visualizations.
Enabling Reports
To enable the Reports feature, you must create a role, create a user, and assign the role to the user.
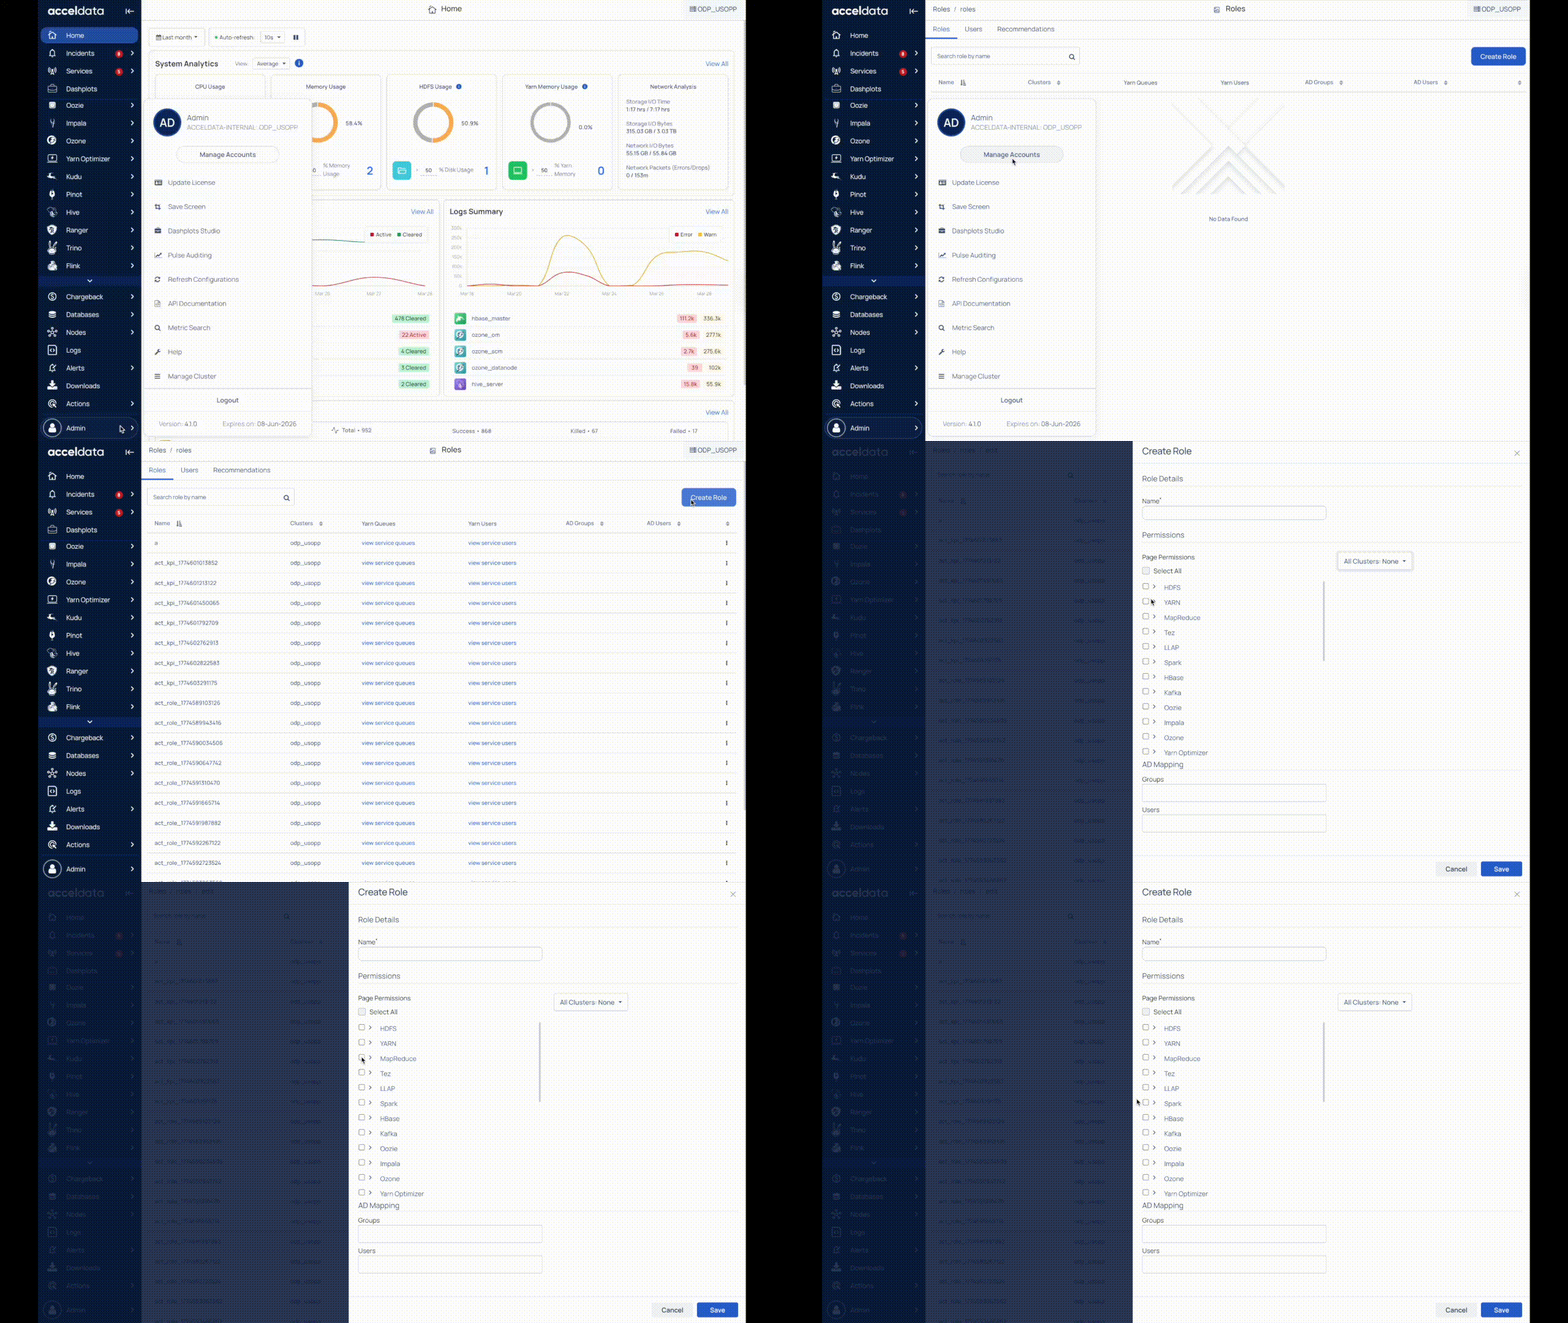
Creating a Role
To create a Role:
- Click the users icon.
- Click +Create Role.
- In the Name field, enter Report_Generator.
- Select the required permissions.
- Click Save.
Create a User
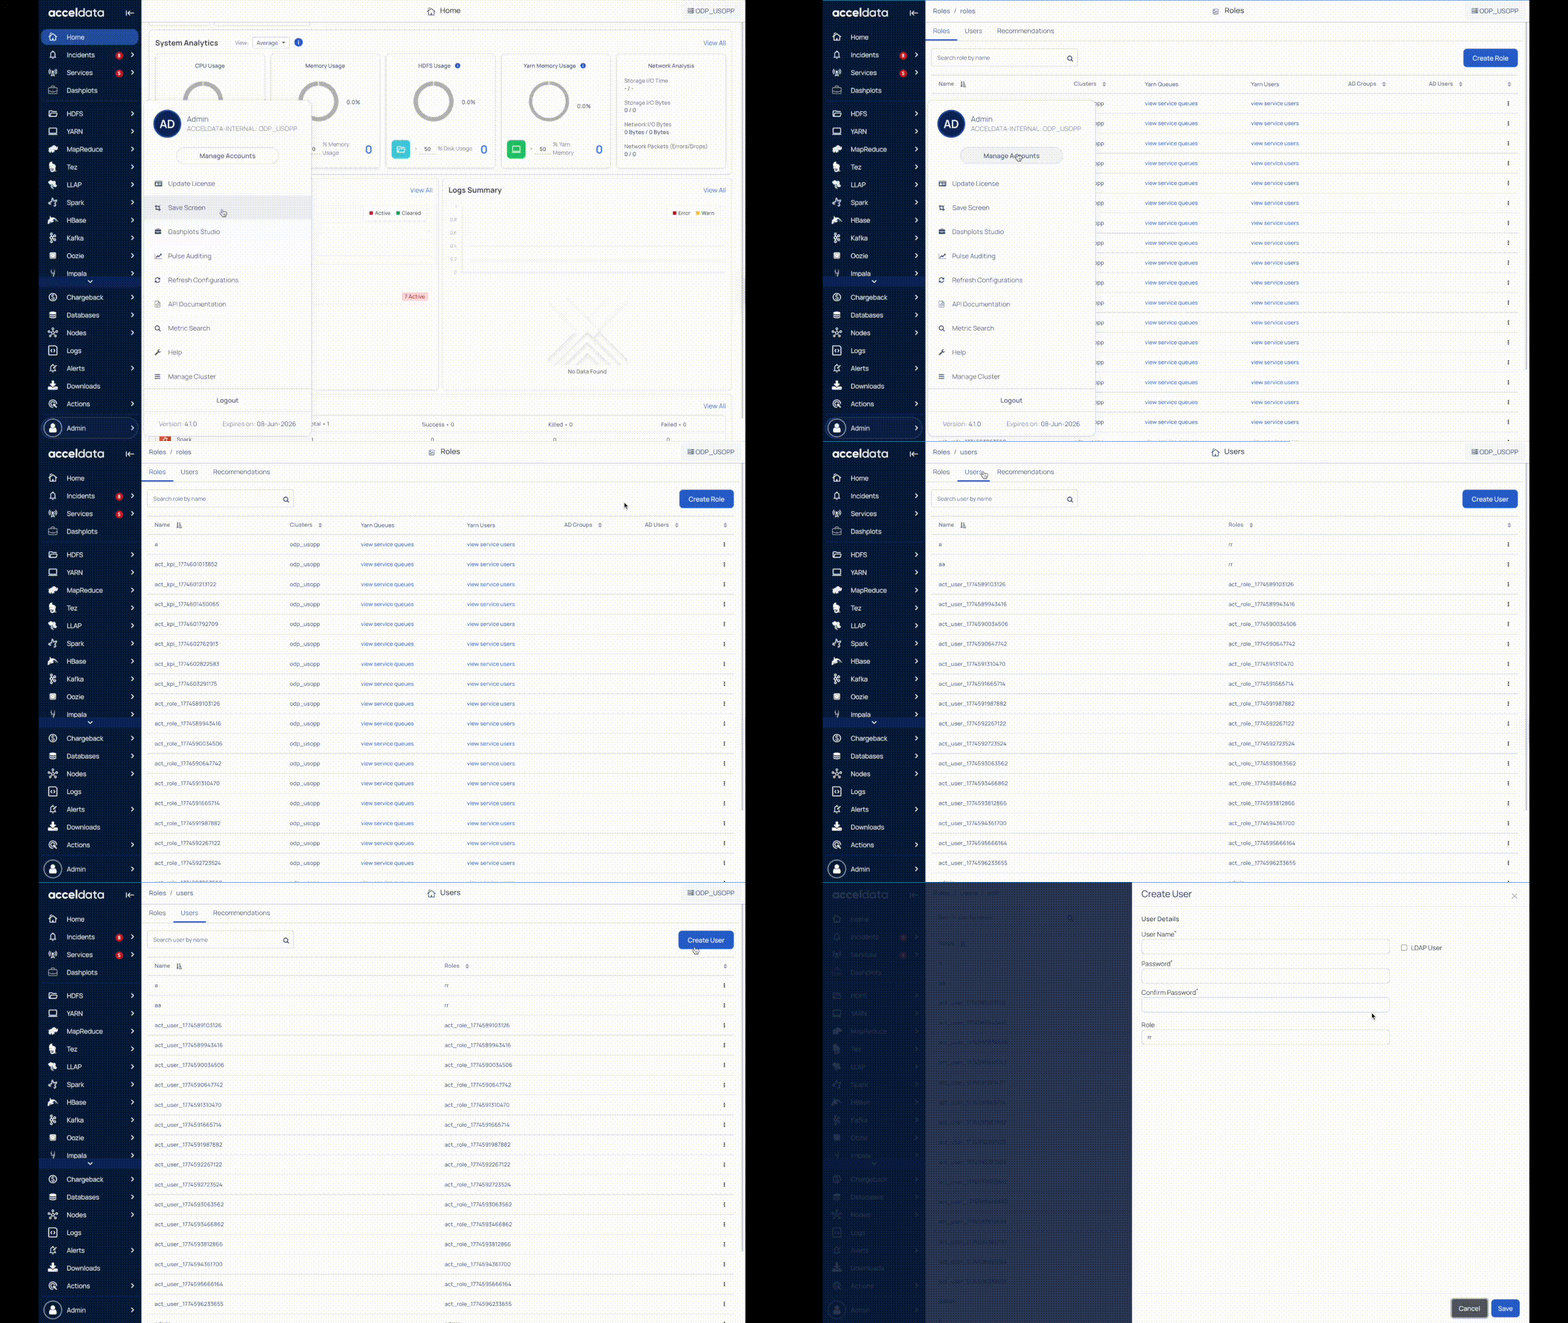
To create a User:
- Click the users icon.
- Click the Users tab.
- Click +Create User.
- Enter report_generator in the User Name field.
- Contact Acceldata SRE team for the password.
- Select the Report_Generator role.
- Click Save.
Add Reports
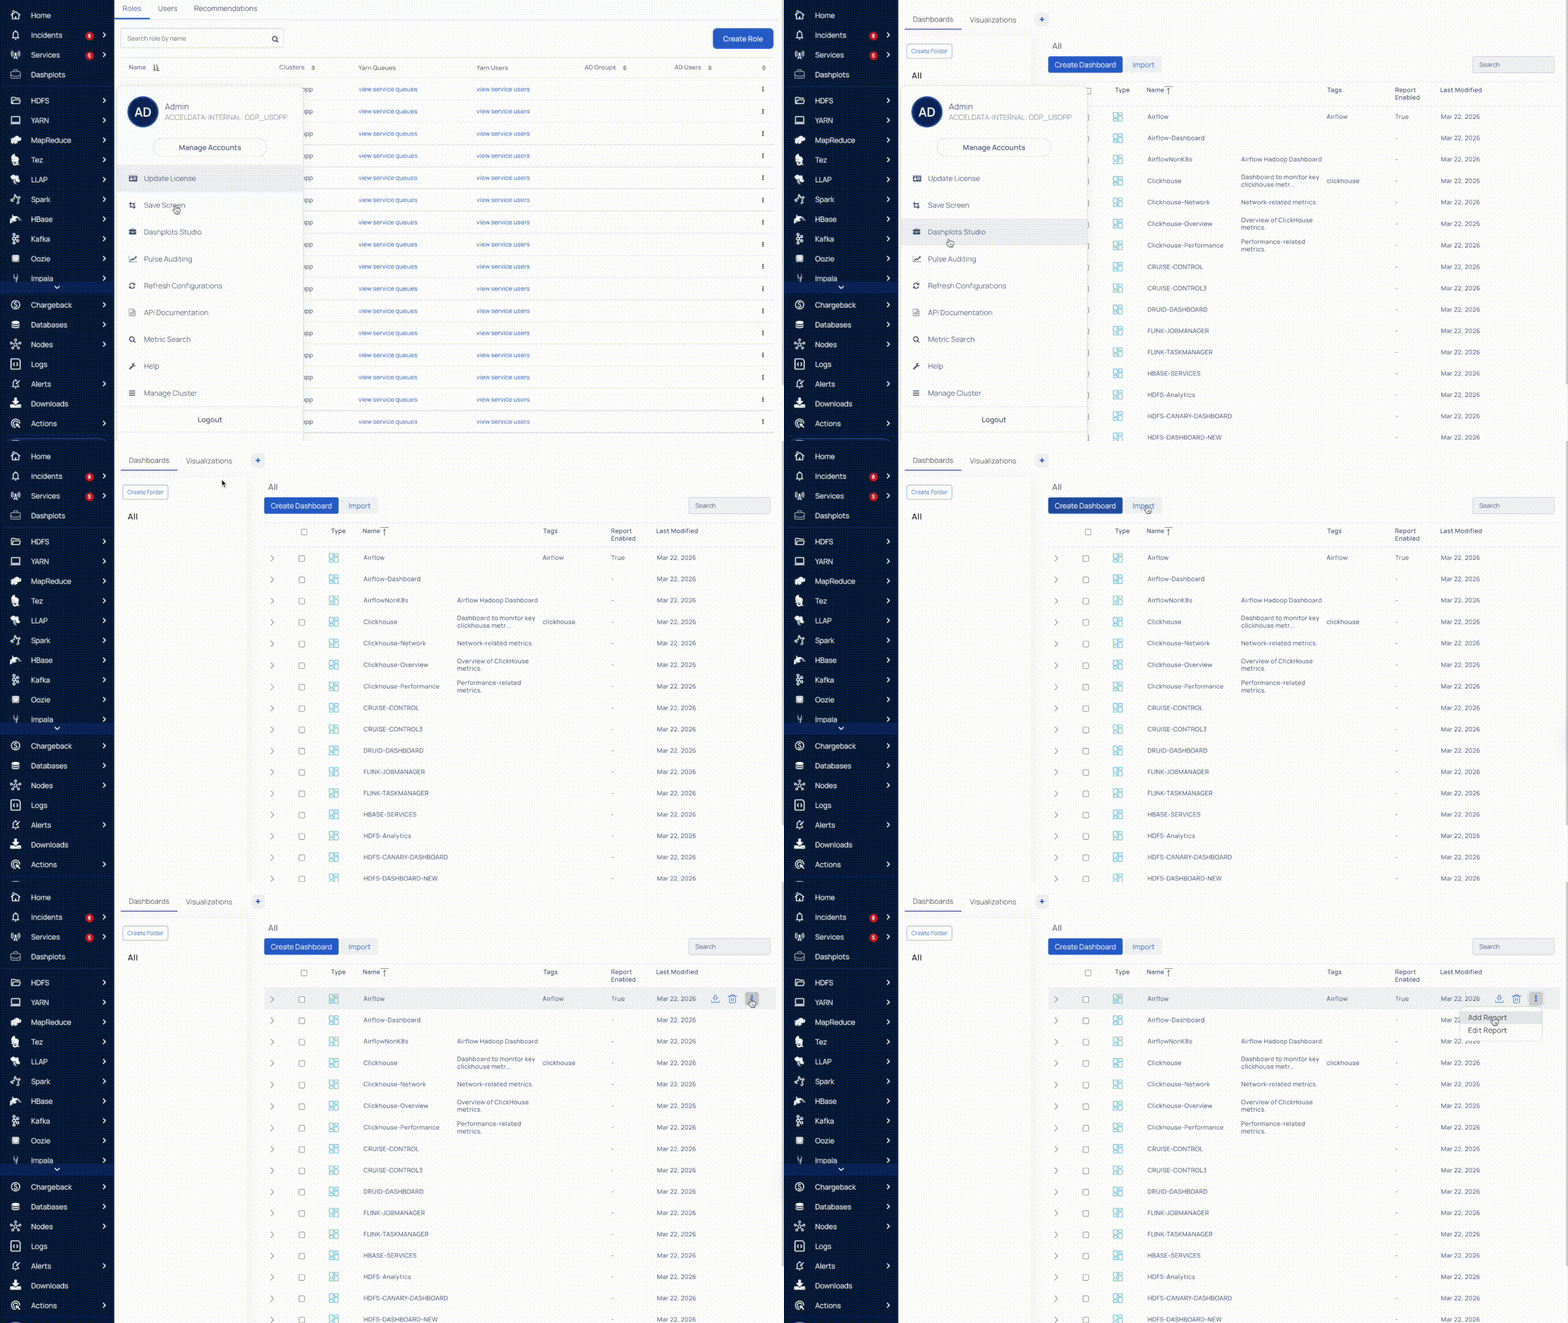
To add reports on Dashboards or Visualizations:
- Navigate to Dashplots.
- Click either Dashboards or Visualizations tab.
- Click the ellipsis menu on the right end for the required Dashboard/Visualization.
- Select Add Report.
Reporting Sections
The Reporting feature has three sections.
Schedule
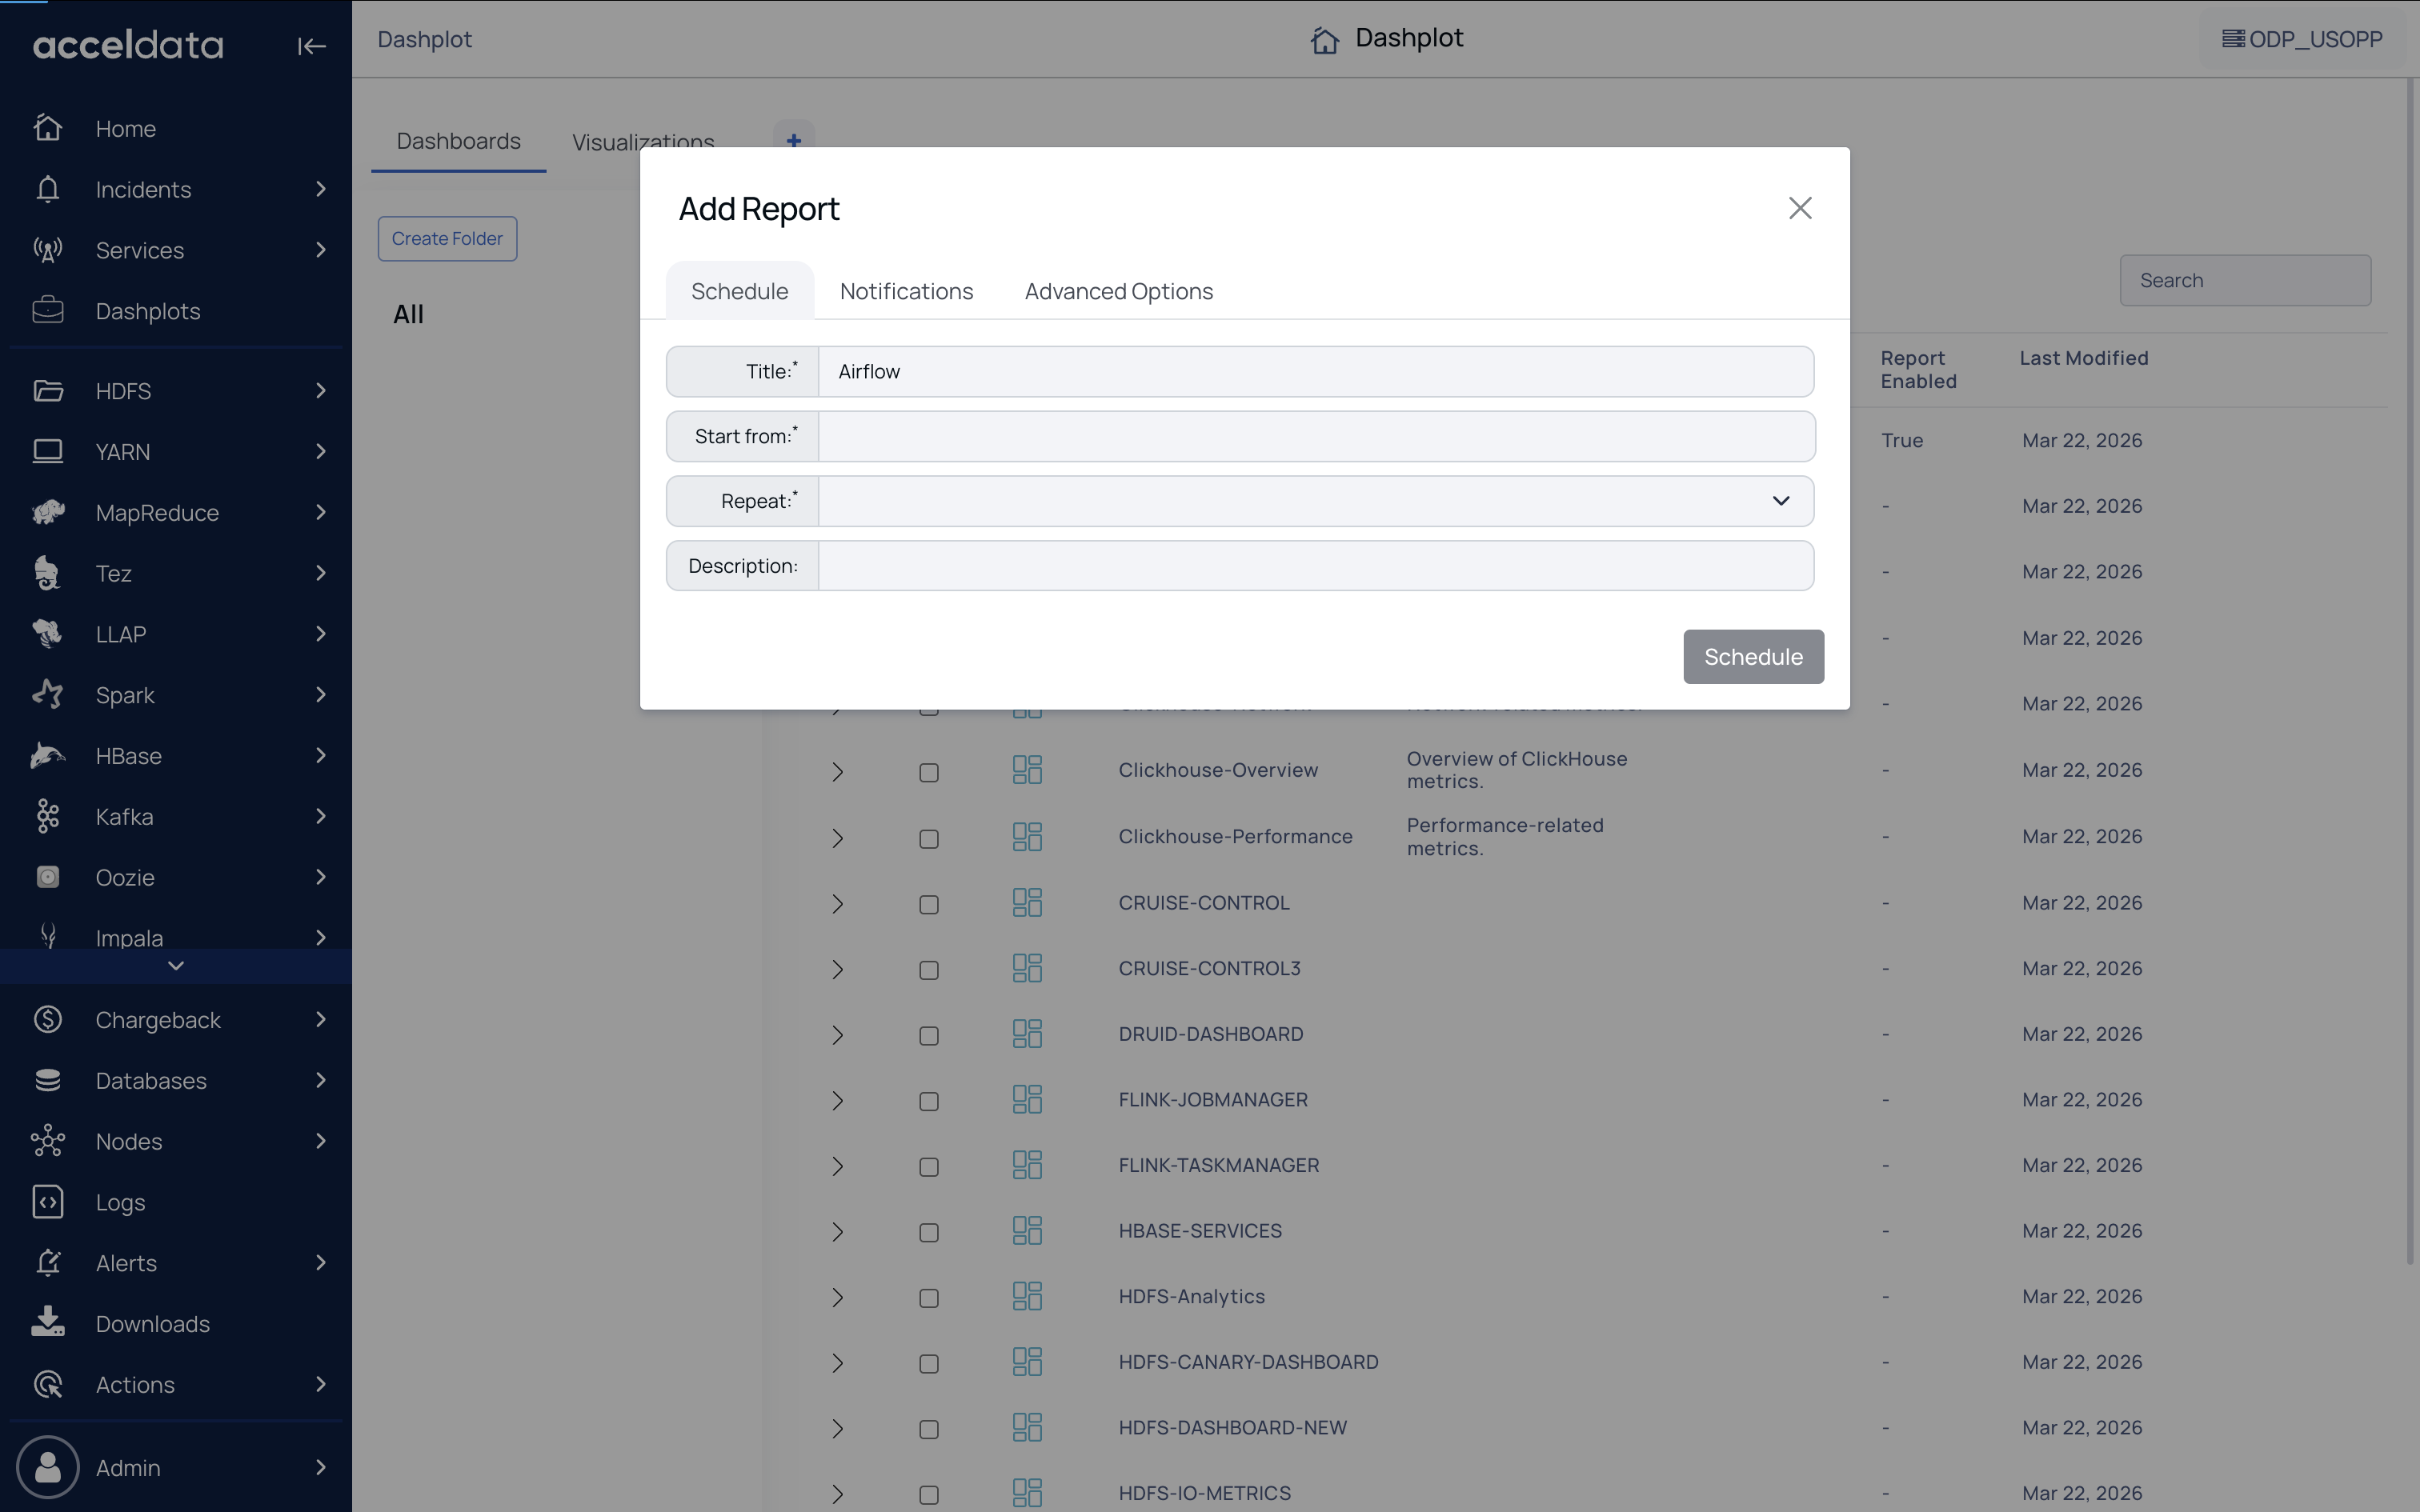
In this section, you can set the schedule and frequency at which you want to receive the reports. The various fields in this section are as follows.
Field | Descriptions |
|---|---|
Title | Displays the assigned name of the visualization. You can change the title. It is a required field. |
Start from | Displays the visualization's default start date. When you click on the date field, a calendar appears where you can edit the day and time. It is a required field. |
Repeat | This determines the frequency of the notifications. The dropdown menu provides the frequency type of Hourly, Daily, Weekly, and Monthly. It is a required field. |
Description | You can give a brief explanation of the type of visualization. |
Notifications
In this section, you can define the recipients of the report.
Info
To integrate Slack with Dashplots, perform the following steps:
- Create User OAuth Token for Slack with scope files:write and files:write:use. For details, see How to create an app and retrieve OAuth token in Slack and https://api.slack.com/authentication.
- Add the environment variable SLACK_USEROAUTH_TOKEN=<user OAuth token> in $AcceloHome/config/docker/addons/ad-notifications.yml and restart ad-notifications.
Field | Description |
|---|---|
Email To: It is a required field. Enter the email address to which the notification should be sent. CC: It is an optional field. Enter the email address to which the notification should be sent. BCC: It is an optional field. Enter the email address to which you want the notification delivered. When you put email addresses in the BCC field of a message, the addresses are hidden from the recipients. | |
Slack | Slack Webhook URL: It is a required field. Enter the webhook URL to which the notification should be sent. |
Note
Always give a unique name to the Report Title. Pulse soft deletes a removed report, creating a new report with the same name as previously will result in a constraint error on the report title.
Email Notification
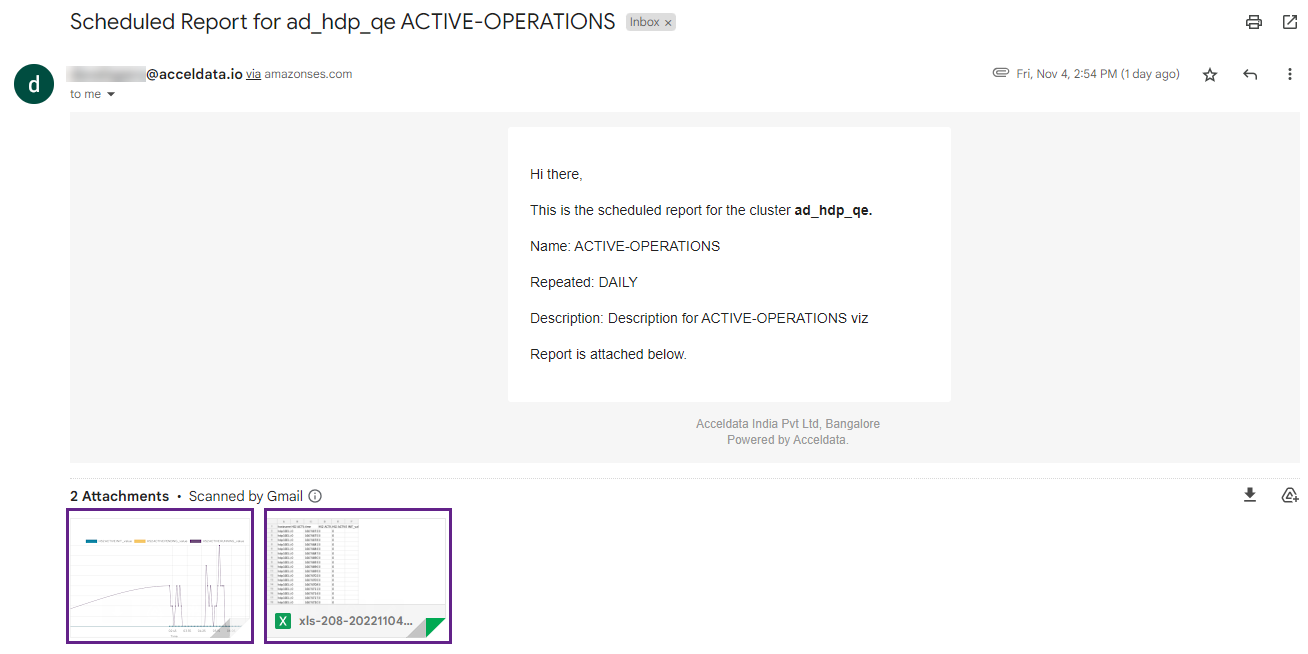
The following is an example of the email notification that is sent to users along with the report.
Slack Notification
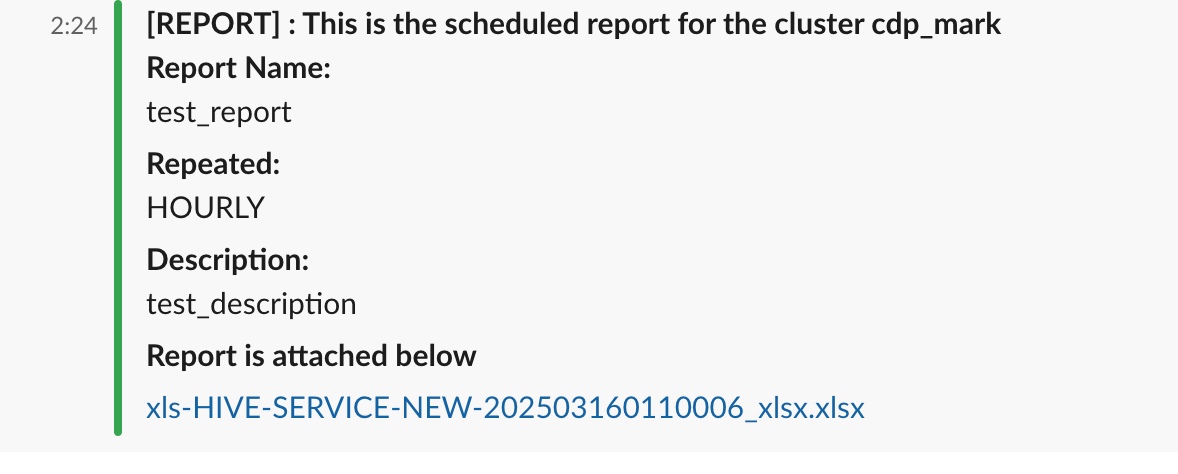
The following is an example of the Slack notification that is sent to users along with the report.
Info
Public file sharing must be enabled in the Slack workspace for you to open Dashplot reports sent via Slack. Without this setting, report links will fail to open.
For details on enabling file sharing, see Manage public file sharing.
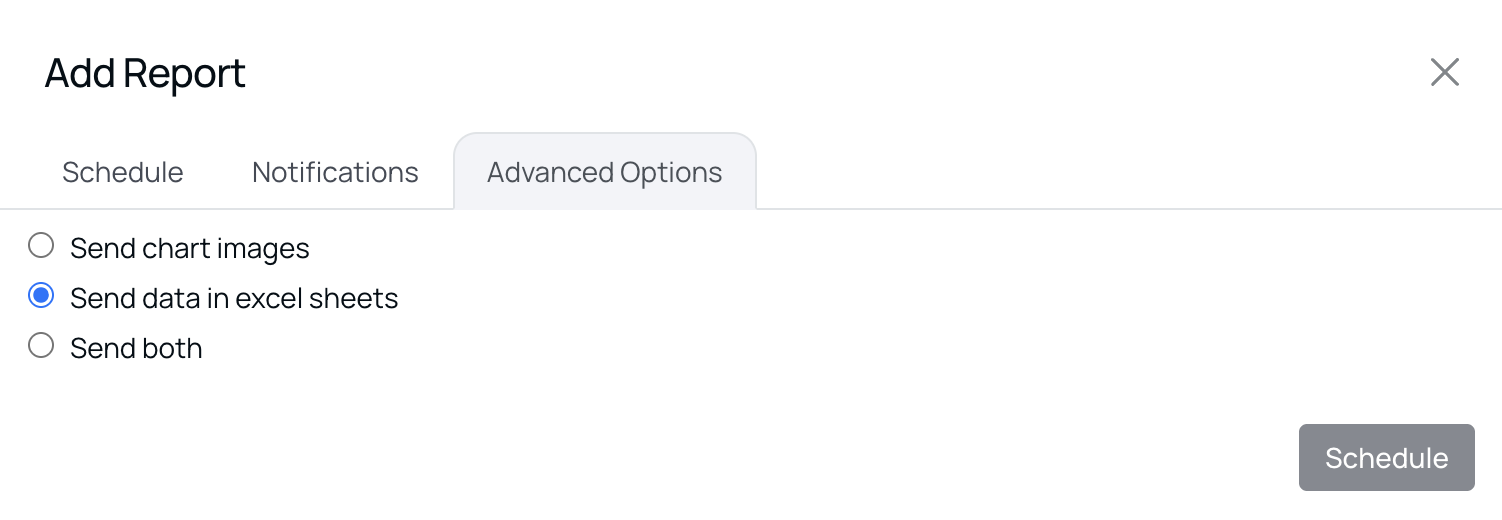
Advanced Options
Starting from version 4.0.1, Pulse supports sending dashboard reports that include both Excel data exports and visual chart renderings directly in email notifications. This enhancement allows you to receive comprehensive reports with graphical visualizations alongside tabular data.
Prerequisites
Chrome Driver Configuration
The dashboard chart reporting feature uses Chrome WebDriver for automated chart rendering. Configure the following variables in your ad-core service:
CHROME_DRIVER_PATH
- Specifies the file path to the Chrome WebDriver executable
- Default: /usr/bin/chromedriver
- Example: CHROME_DRIVER_PATH=/usr/bin/chromedriver
CHROME_DRIVER_ARGUMENTS
- Comma-separated list of Chrome browser arguments for headless operation
- Default: Includes security and performance flags such as --headless=new, --no-sandbox, --disable-gpu
- Purpose: Configures Chrome for secure, performant headless rendering
- Example: CHROME_DRIVER_ARGUMENTS=--headless=new,--no-sandbox,--disable-gpu,--disable-dev-shm-usage
Report Generator Credentials
The report generator service account credentials can be customized using these environment variables:
REPORT_GENERATOR_USERNAME
- Username for the report generator service account used to authenticate and access dashplots
- Default: report_generator
- This should match the username created in the "Create a User" step above
REPORT_GENERATOR_PASSWORD
- Password for the report generator service account
- Default: report_generator
- Security Note: Change the default password in production environments
- Contact the Acceldata Support team for the recommended password
Configuration Steps
Enable Dashboard Chart Rendering
To enable dashboard chart reporting functionality, you must set the HOME environment variable to /tmp in the ad-dashplots service configuration.
In your docker-compose.yml or deployment configuration:
services:
...
ad-dashplots:
...
environment:
...
- HOME=/tmp
Why this is required: The Chrome WebDriver process requires a writable home directory for temporary files during chart rendering. Setting HOME=/tmp ensures the service has the necessary permissions.
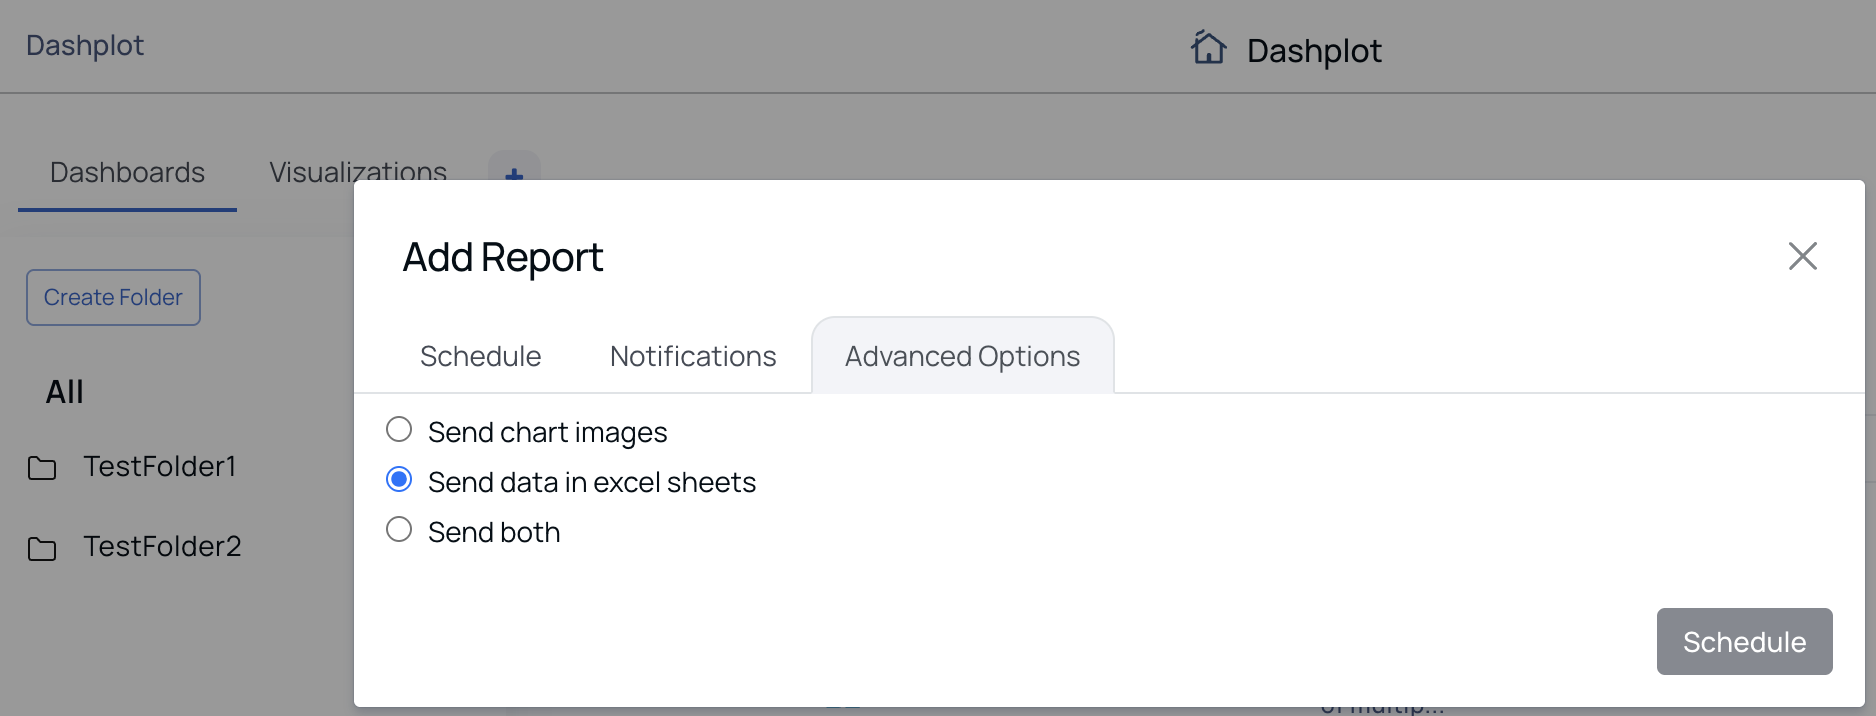
On the Advanced Options tab, select one of the three based on your requirement.
- Send chart images
- Send data in Excel sheets
- Send both