
HBase Proctor
HBase Proctor page enables a data proctor to monitor and find anomalies in the HBase cluster.
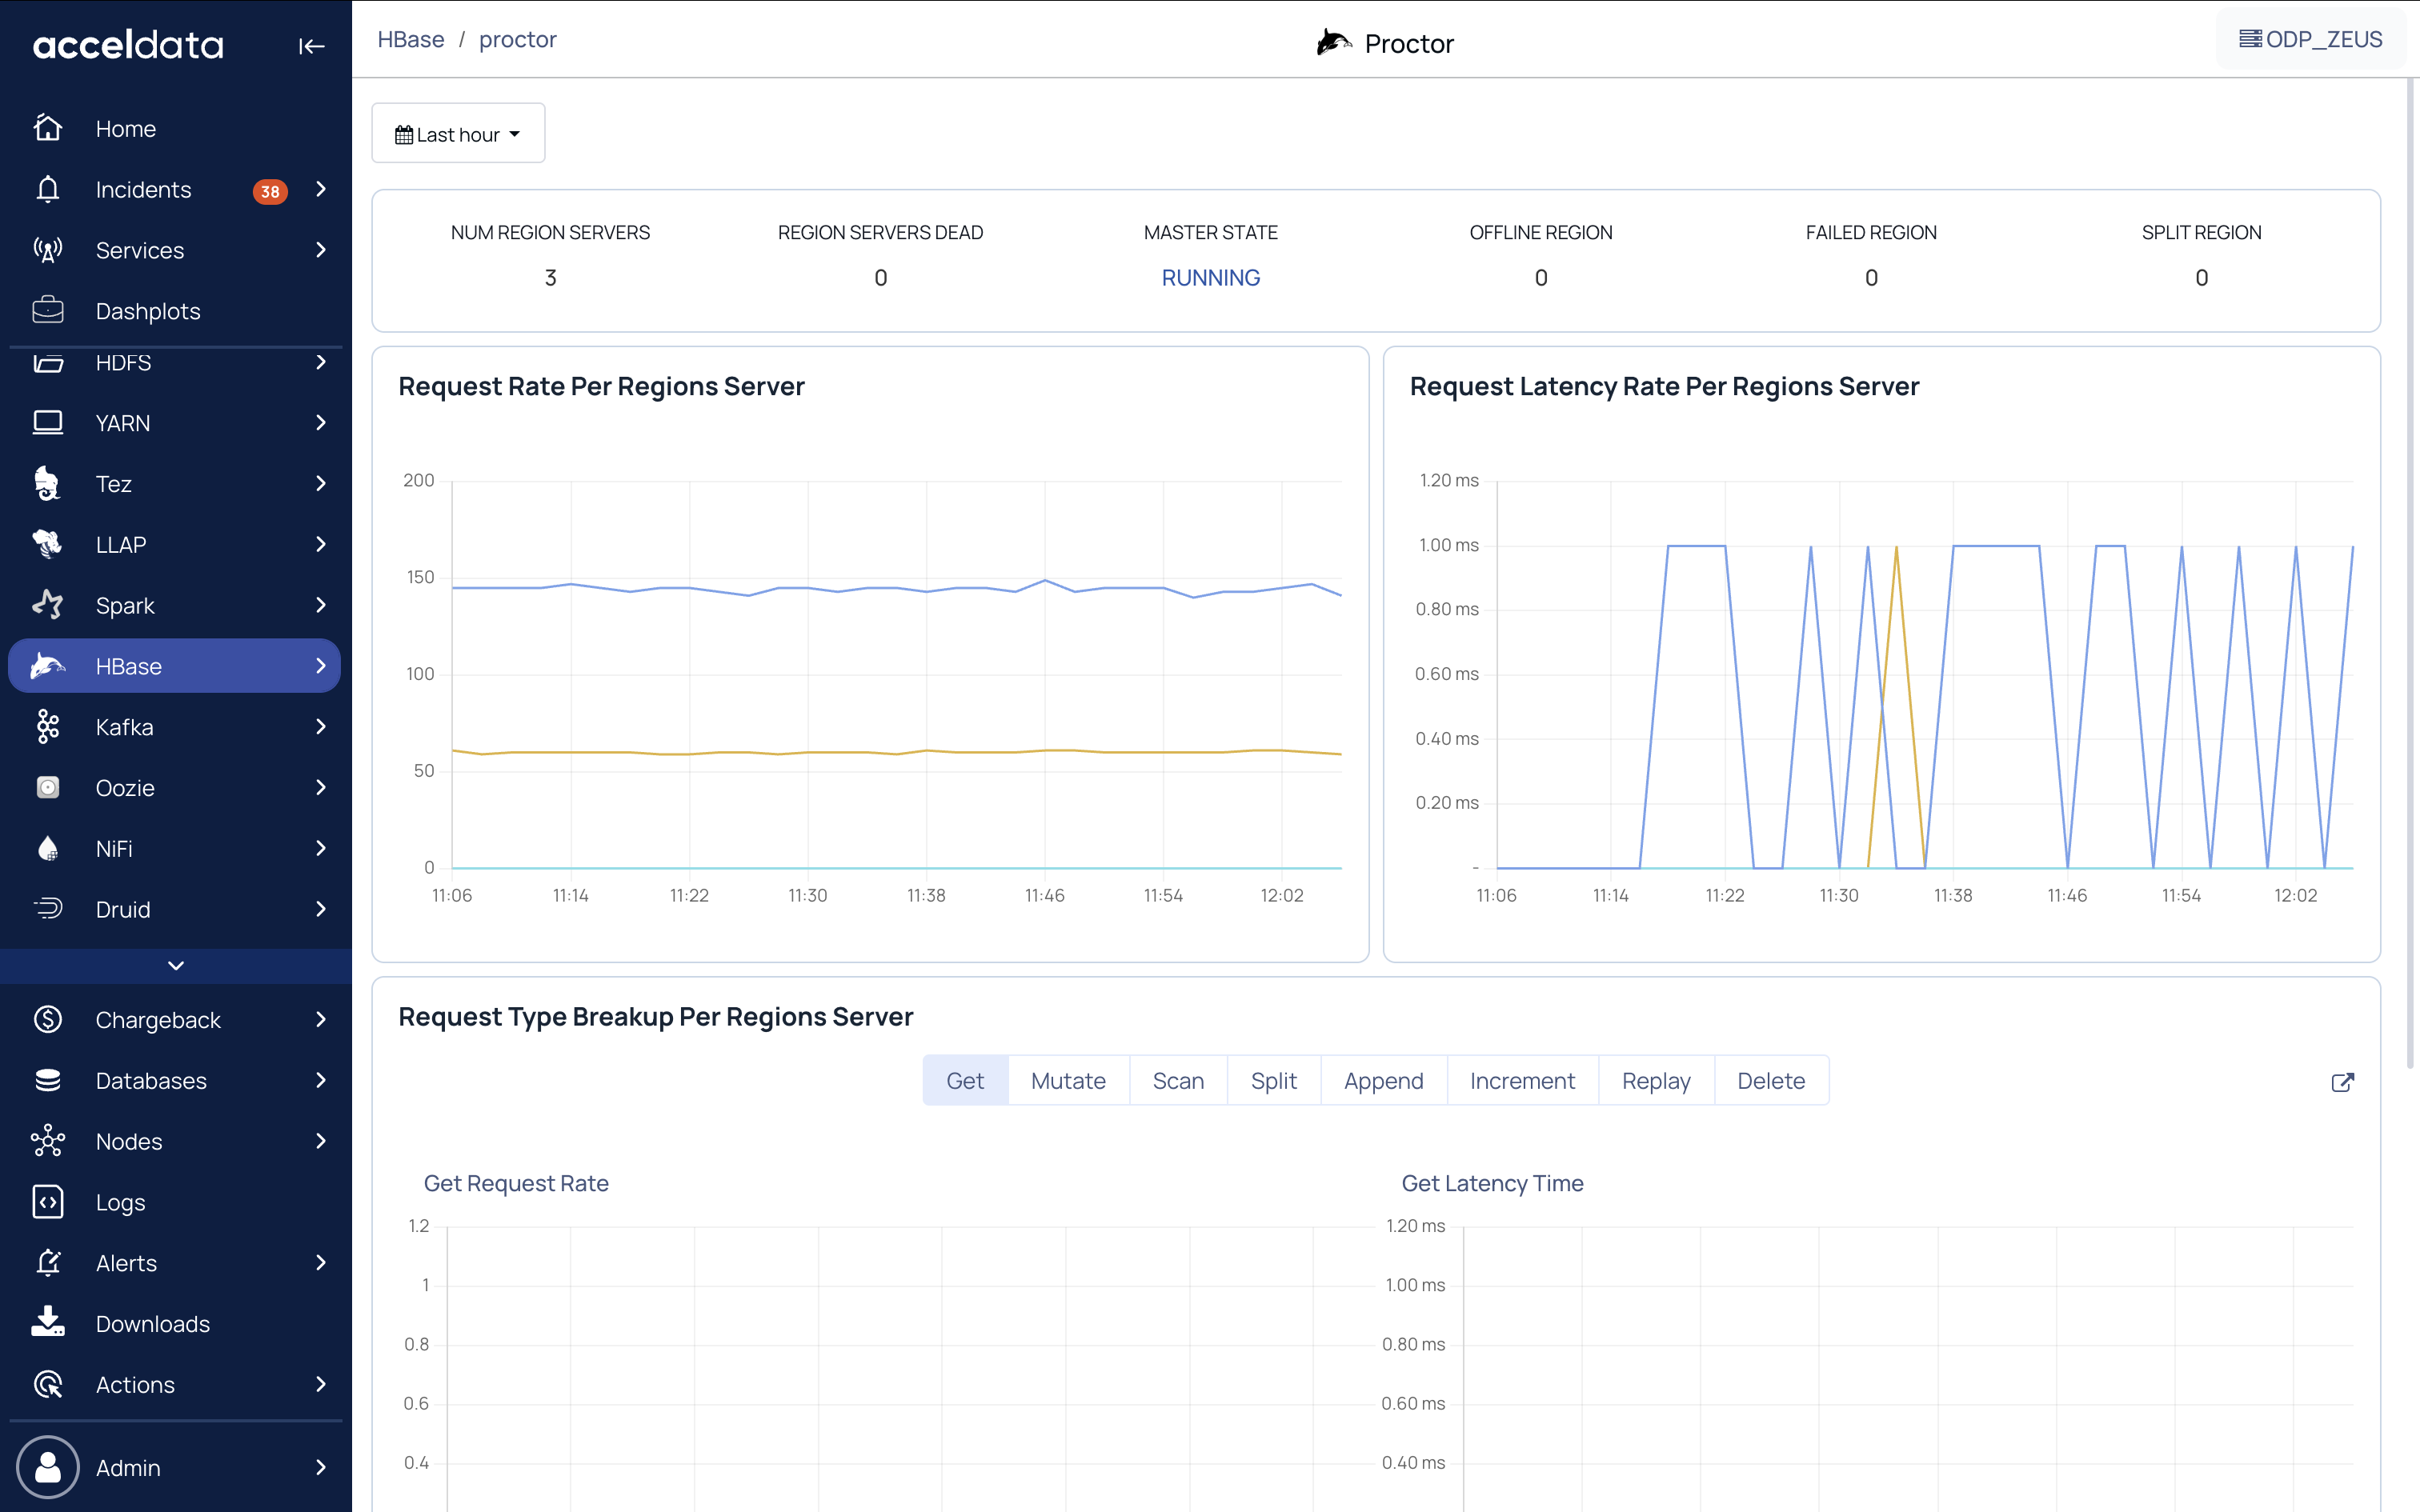
To view the HBase proctor page click HBase --> Proctor from the side navigation bar. The HBase Proctor page is displayed.
Note
The statistics displayed are from the last 24 hours by default. To view statistics from a custom date range, click the Time frame icon in the top-right corner of the page and select the required time frame and timezone.
Summary Panel
The summary panel of the HBase Proctor page displays the metrics that are described in the below table:
Metrics | Description |
|---|---|
Num Region Servers | The number of region servers in the cluster |
Region Servers Dead | The number of dead region servers in the cluster |
Master State | The state of the HBase Master, whether it is running or stopped |
Offline Region | The number of offline regions in the region server |
Failed Region | The number of failed regions in the region server |
Split Region | The number of split regions in the region server |
Charts in the HBase Proctor page
The following charts are displayed in the HBase Proctor page:
Request Rate Per Region Server
This chart displays a consolidated number of requests sent to the each region server.
Request Latency Rate Per Regions Server
This chart displays the duration taken to serve the incoming requests.
Request Type Breakup Per Region Server
The following table describes the charts displayed based on the function selected for it:
All charts display the 95th percentile metrics for each function.
Function | Description |
|---|---|
Get | Displays the following charts with the number of read requests and duration taken to serve the read requests. |
Mutate | Displays the following charts with the number of write requests and duration taken to serve the write requests. |
Scan | Displays the following charts with the number of read requests and duration taken to serve the read requests. |
Split | Displays the following charts with the number of split region requests and the duration taken for the region to split. |
Append | Displays the following charts with the number of append requests and duration taken to serve the requests. |
Increment | Displays the following charts with the number of increment requests and duration taken to serve the requests. |
Replay | Displays the following charts with the number of replay requests and duration taken to serve the requests. |
Delete | Displays the following charts with the number of delete requests and duration taken to serve the requests. |
Click icon to display Request Type Breakup per Region Servers charts in a new tab.
Region Servers
The following table describes the status of the region servers with the help of the following metrics:
Metric | Description |
|---|---|
Host | The name of the host or region server |
Num Region | The number of regions in the region server |
Heap Used | The storage space used by the region server |
Heap Allocated | The storage space allocated to the region server |
GC Time | The total time spent in Java Garbage Collections |
Block Cache Hit (%) | Percentage of reads serviced from block cache without reading from the disk |
Read File Latency | File system level read latency at Operating System level per Region Server |
Write File Latency | File system level write latency at Operating System level per Region Server |
Percent File Local | The percentage of files served from the local Data Node for the region server in the cluster |
Compaction Time | The time taken for compaction |
Compaction Queue | The number of stores in the regions that have been targeted for compaction |