
Monitor Spark
Apache Spark is a distributed data processing engine used for large-scale analytics and data processing. It provides fast, scalable, and fault-tolerant execution for batch and streaming workloads across clustered environments.
Observability with xObserve
Monitor Spark applications deployed on your xCompute cluster through xObserve to:
- Track overall Spark workload activity and cluster health.
- Monitor resource utilization, including CPU and memory allocation.
- Analyze Spark job execution, performance, and status.
- Investigate individual job details for troubleshooting and optimization.
- Identify workload trends and user activity across the cluster.
- Detect failures and performance bottlenecks proactively.
Prerequisites
To enable Spark observability:
- Enable the xObserve Integration toggle for the Spark application in the XDP UI.
- You can enable this option:
- During Spark installation, or
- By clicking Edit on an existing Spark application.
Once enabled, Spark metrics become available in xObserve.
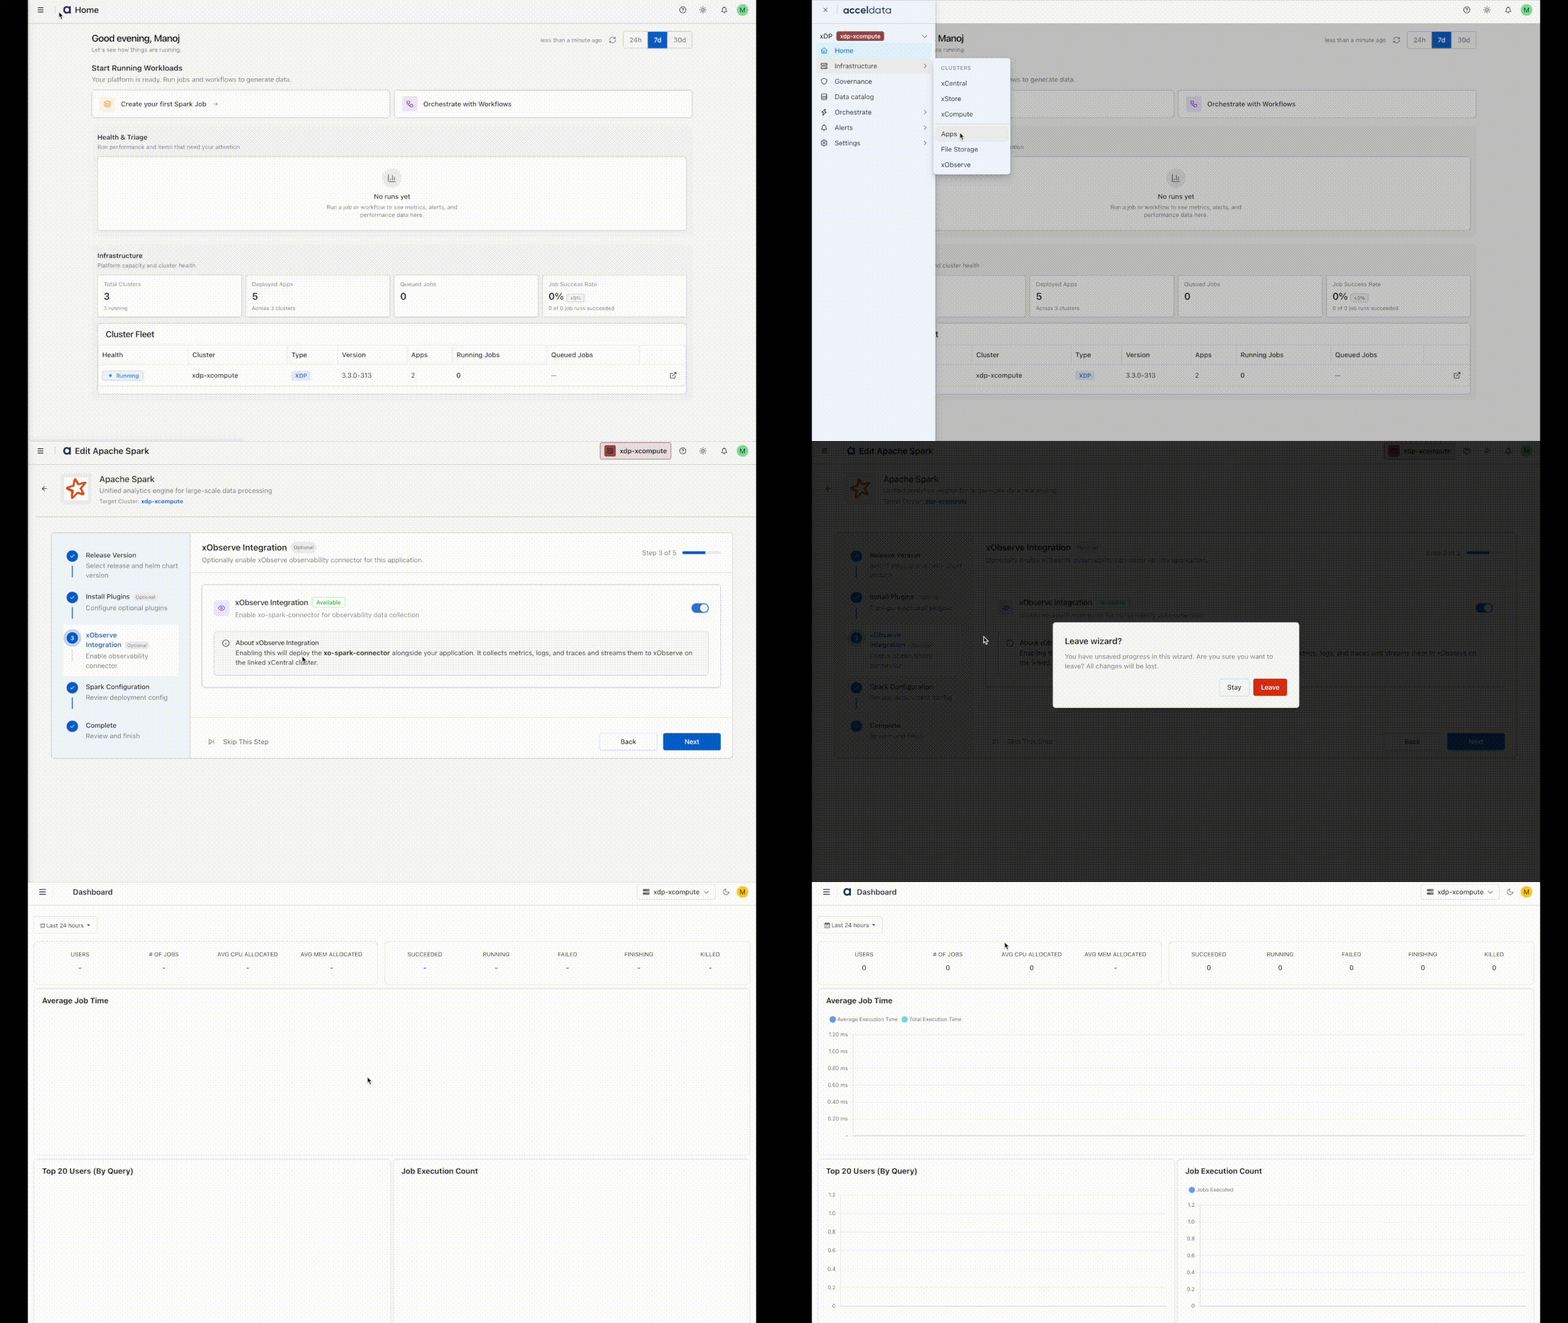
Navigation Steps
- In the XDP UI, navigate to Infrastructure from the left navigation pane.
- Select Apps.
- On the Apps page, locate the Spark application and click the xObserve icon.
- The Spark application dashboard opens in xObserve, where you can view application metrics, performance insights, and health information.