
Optimization Dashboard (K8s)
This dashboard provides an overall picture of cluster efficiency, allocations (requested resources), and optimization opportunities by identifying the gap between requested vs actually used CPU/memory.
Steps
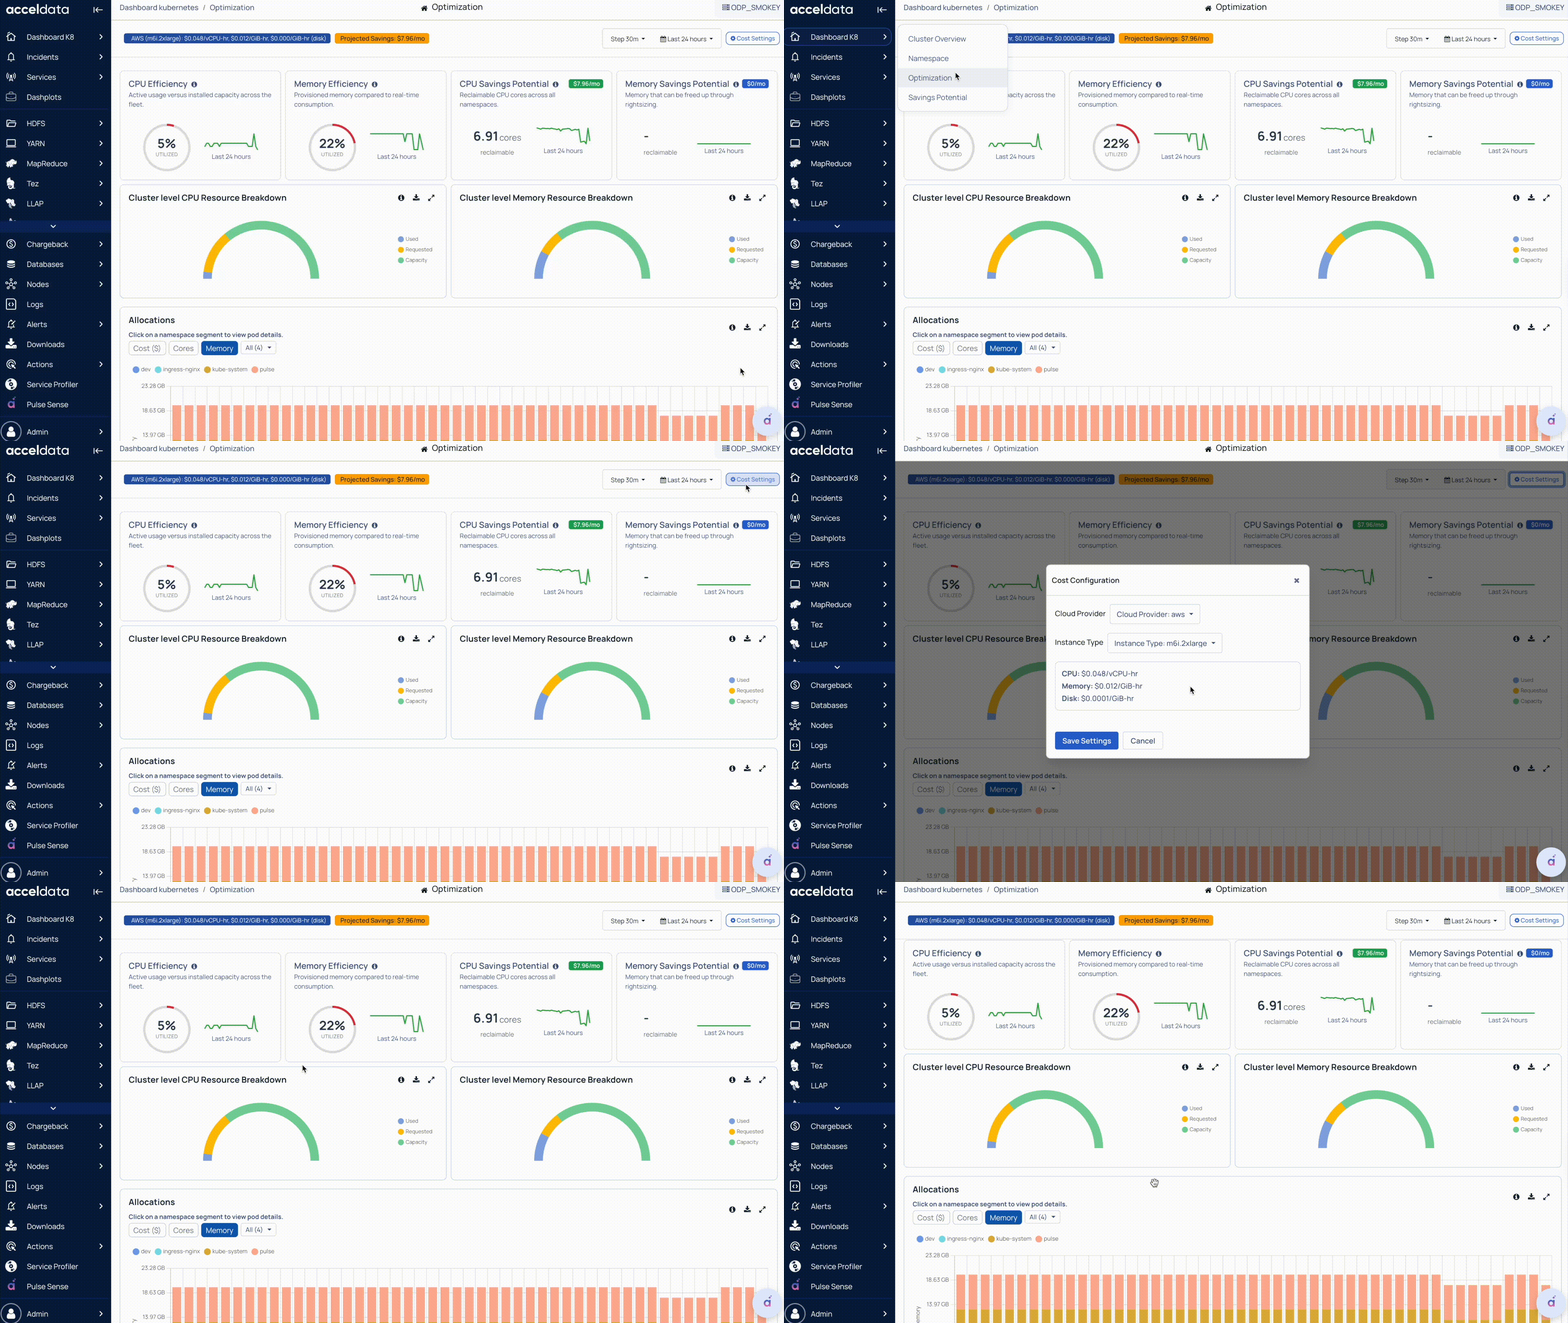
- In the Pulse UI, go to Dashboard K8s on the left pane.
- Select Optimization.
- Select Step Interval (how often the dashboard update) and Time Period.
- In Cost Settings:
- Cloud Provider: Select the cloud service provider.
- Instance Type: Select the instance type.
- Click Save Settings.
You can see the dashboard details are updated based on the selection.
Efficiency and Savings Potential
CPU Efficiency
- Shows how much CPU is actually used compared to the cluster’s total CPU capacity over the selected time range.
- Lower efficiency typically indicates the CPU is over-requested or underutilized across workloads.
Memory Efficiency
- Shows how much memory is actually used compared to the cluster’s total memory capacity.
- Helps identify memory over-allocation at a cluster level.
CPU Savings Potential
- Shows the difference between how much all the pods combined are requesting and how much the actual utilization is on the cluster level.
Memory Savings Potential
- Estimates reclaimable memory (GB) using the same request-vs-usage gap for memory.
- Helps quantify how much memory could potentially be freed up.
Cluster-Level CPU Resource Breakdown
Breaks down CPU into:
- Used (actual consumption)
- Requested (what pods asked for)
- Capacity (total available in the cluster)
This gives us the overall picture of the cluster resources' state
Cluster-Level Memory Resource Breakdown
Same breakdown for memory:
- Used, Requested, and Capacity
- Shows whether memory inefficiency is due to over-requesting.
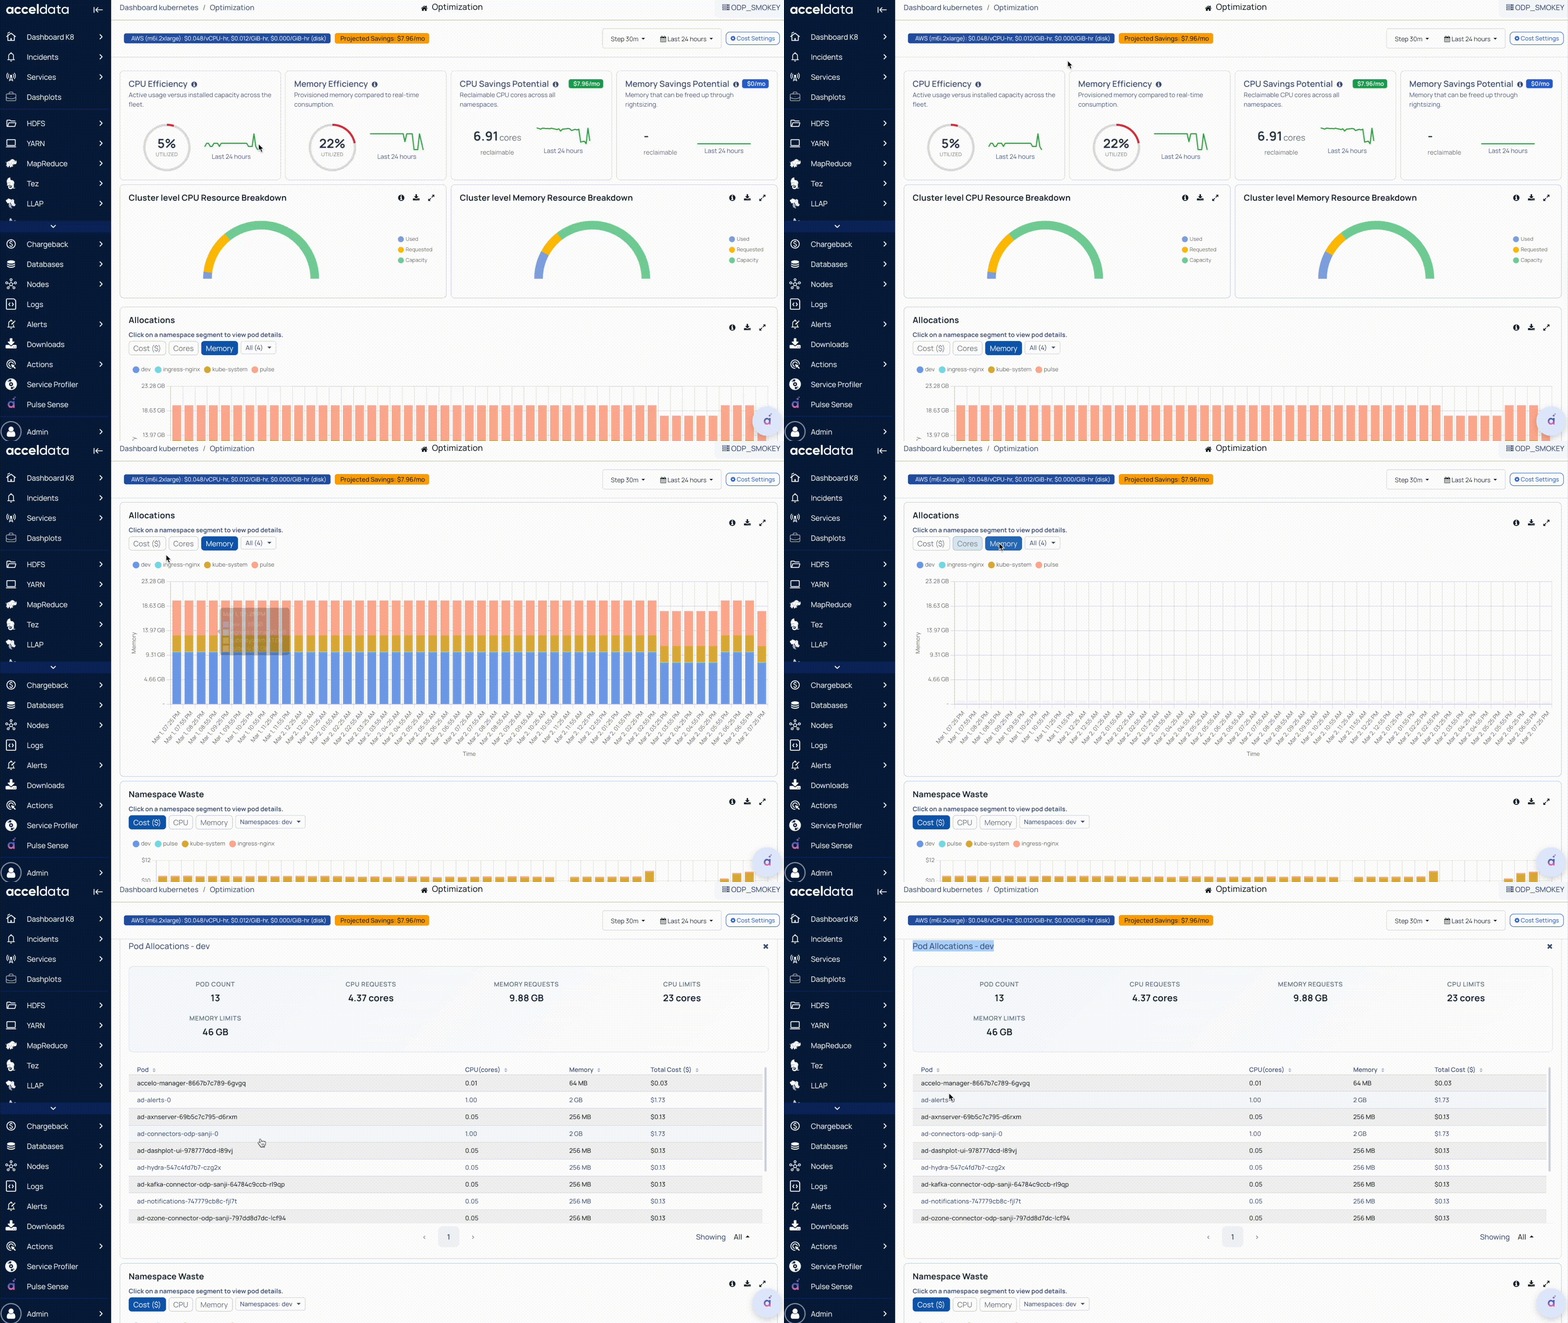
Allocations (by Namespace)
- Time-series view of how much resource is requested (allocated) per namespace.
- You can switch between Cost, Cores, and Memory, and filter namespaces to understand which namespaces are driving allocations.
- In this context, “Allocated” refers to what workloads were requested, not necessarily what they used.
Click on a namespace to view pod details.
Pod Allocation:
- Pod Count
- CPU Requests
- Memory Requests
- CPU Limits
- Memory Limits
Pod Details:
- Pod Name
- CPU (cores)
- Memory
- Total Cost ($)
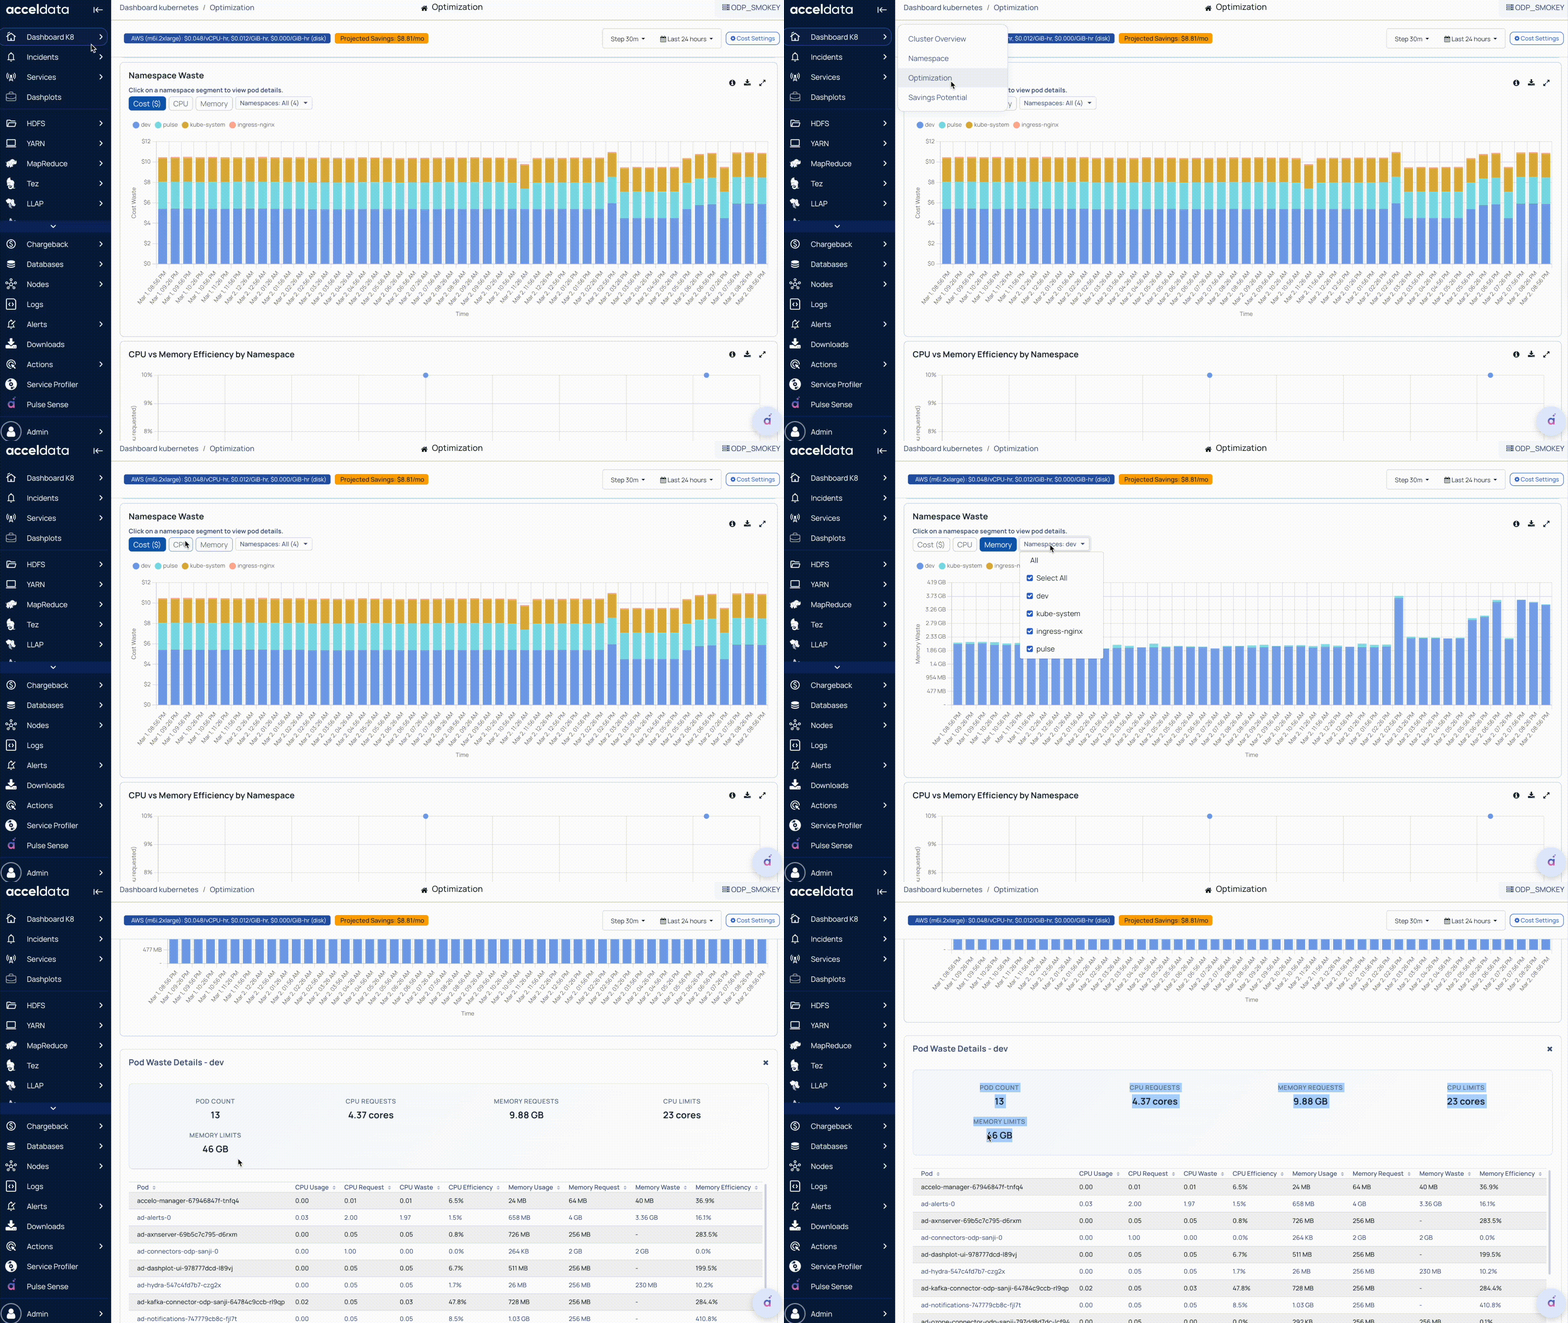
Namespace Waste
- Shows waste per namespace based on the difference between requested and used resources at a pod level (CPU & memory).
- Clicking a namespace provides pod-level details (requests, usage-related efficiency/waste, and cost impact).
Click on a namespace to view pod details.
POD Allocation:
- Pod Count
- CPU Requests
- Memory Requests
- CPU Limits
- Memory Limits
POD Details:
- CPU Usage, CPU Request, CPU Waste, CPU Efficiency
- Memory Usage, Memory Request, Memory Waste, Memory Efficiency
CPU vs Memory Efficiency by Namespace
This helps in comparing namespace efficiency:
- One axis = CPU efficiency
- Other axis = memory efficiency
Namespaces closer to the “balanced” zone (100 percent) indicate healthier request-to-usage alignment; extremes indicate under- or over-request patterns.
- If the efficiency is more than 100 percent, it means that the request value is a lot different than the actual usage.
- If the efficiency is less than 100 percent, it means that the usage is less than the requested value.
Cluster-Level Idle Cost Breakdown
Splits idle cost into:
- Workload idle (idle due to workload over-requesting)
- Infrastructure idle (idle due to cluster/node-level capacity not being utilized)
Idle Cost by Namespace (Top 8)
- Ranks namespaces contributing the most idle cost (CPU + memory).
- Useful to prioritize optimization efforts.
Other Details
- Node Free Memory
- Shows available (free) memory per node.
- Useful for capacity planning and spotting nodes with headroom.
- Node Memory Utilization
- Shows memory utilization % per node.
- Helps detect hotspots or imbalances across nodes.
- Per Node CPU Metrics
- Compares CPU Usage vs CPU Allocation at the node level.
- Helps identify nodes with consistent over-allocation or underutilization.
- Per Node Memory Metrics
- Compares Memory Usage vs Memory Allocation at the node level.
- Highlights nodes where memory is frequently over-requested.
- Cluster-Wide CPU Utilization
- Time-series trend of overall CPU utilization across the cluster (all nodes combined).
- Helps correlate workload activity and cluster scaling behavior.