Compare Nodes Resource Usage
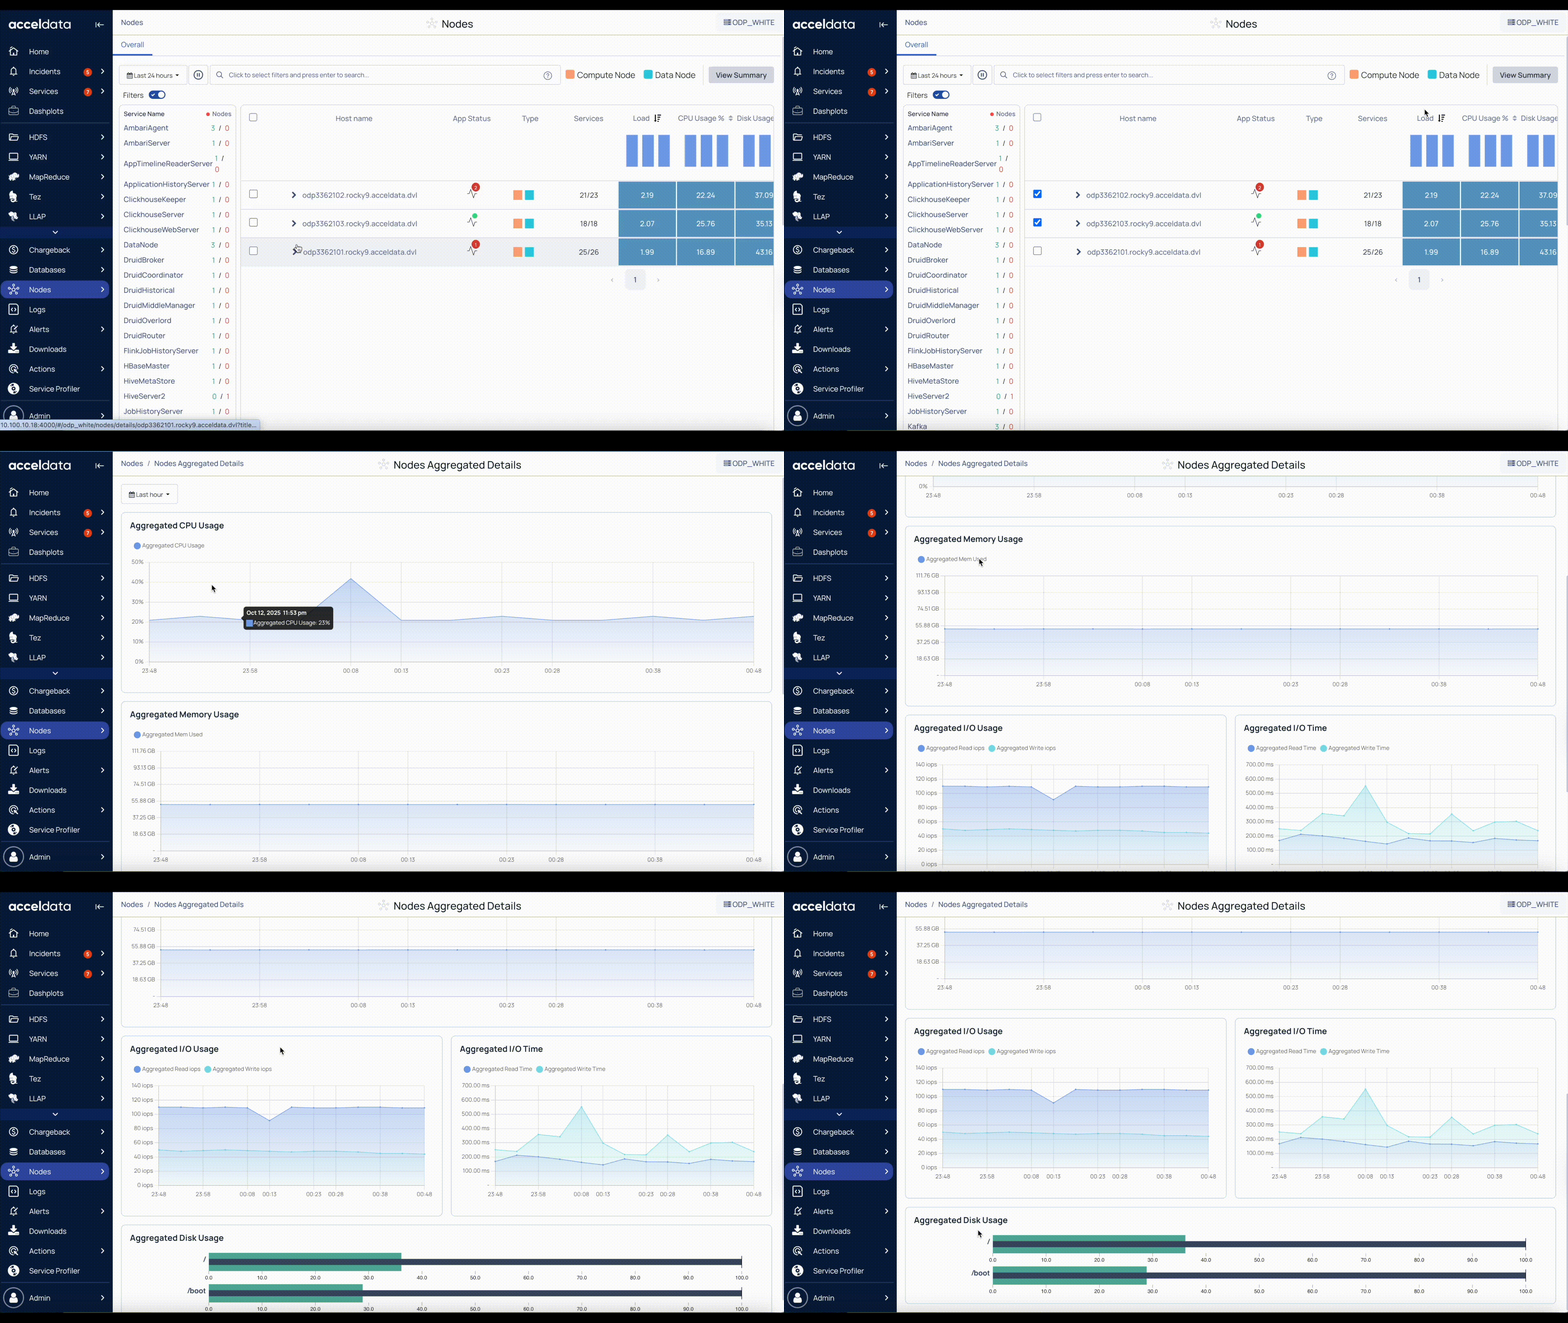
The Nodes Aggregated Details page in Pulse provides a consolidated view of resource usage across multiple selected nodes. It displays aggregated metrics for CPU, memory, disk, and input/output operations.
This enables easy comparison of node performance and helps you identify patterns, trends, and potential bottlenecks across the cluster.
Steps
- In the Pulse UI, go to Nodes on the left navigation bar > Summary.
- On the Nodes page, set time range and auto-refresh:
- Set time range – Select Today, Last 12 hours, Last 3 months, or choose a custom period. Then select Apply.
- Refresh status – Select Play (⏵) to refresh the page automatically every 10 seconds. Select Pause (⏸) to stop auto-refresh.
- Select two or more nodes.
- Click View Summary to open the Nodes Aggregated Details page.
- On the Nodes Aggregated Details page, explore the detailed charts:
- Aggregated CPU Usage: Average CPU utilization across the selected nodes.
- Aggregated Memory Usage: Total memory usage across the selected nodes.
- Aggregated I/O Usage: Input/output bytes per second, including read and write IOPS.
- Aggregated I/O Time**:** Time spent performing I/O operations, including read and write time (ms).
- Aggregated Disk Usage: Total disk usage for boot drives and mounted storage, shown as a percentage for each partition.