
Node Aggregation Details
The Node Aggregated Details page provides a consolidated view of resource usage across selected nodes, including aggregated metrics for CPU utilization, memory consumption, input/output time, and disk usage. This allows for easy comparison of node performance, helping to identify patterns, trends, and potential bottlenecks across the cluster.
- Log in to the Pulse UI and navigate to Home > Overview.
- Select more than two nodes on the Nodes details page and click View Summary.
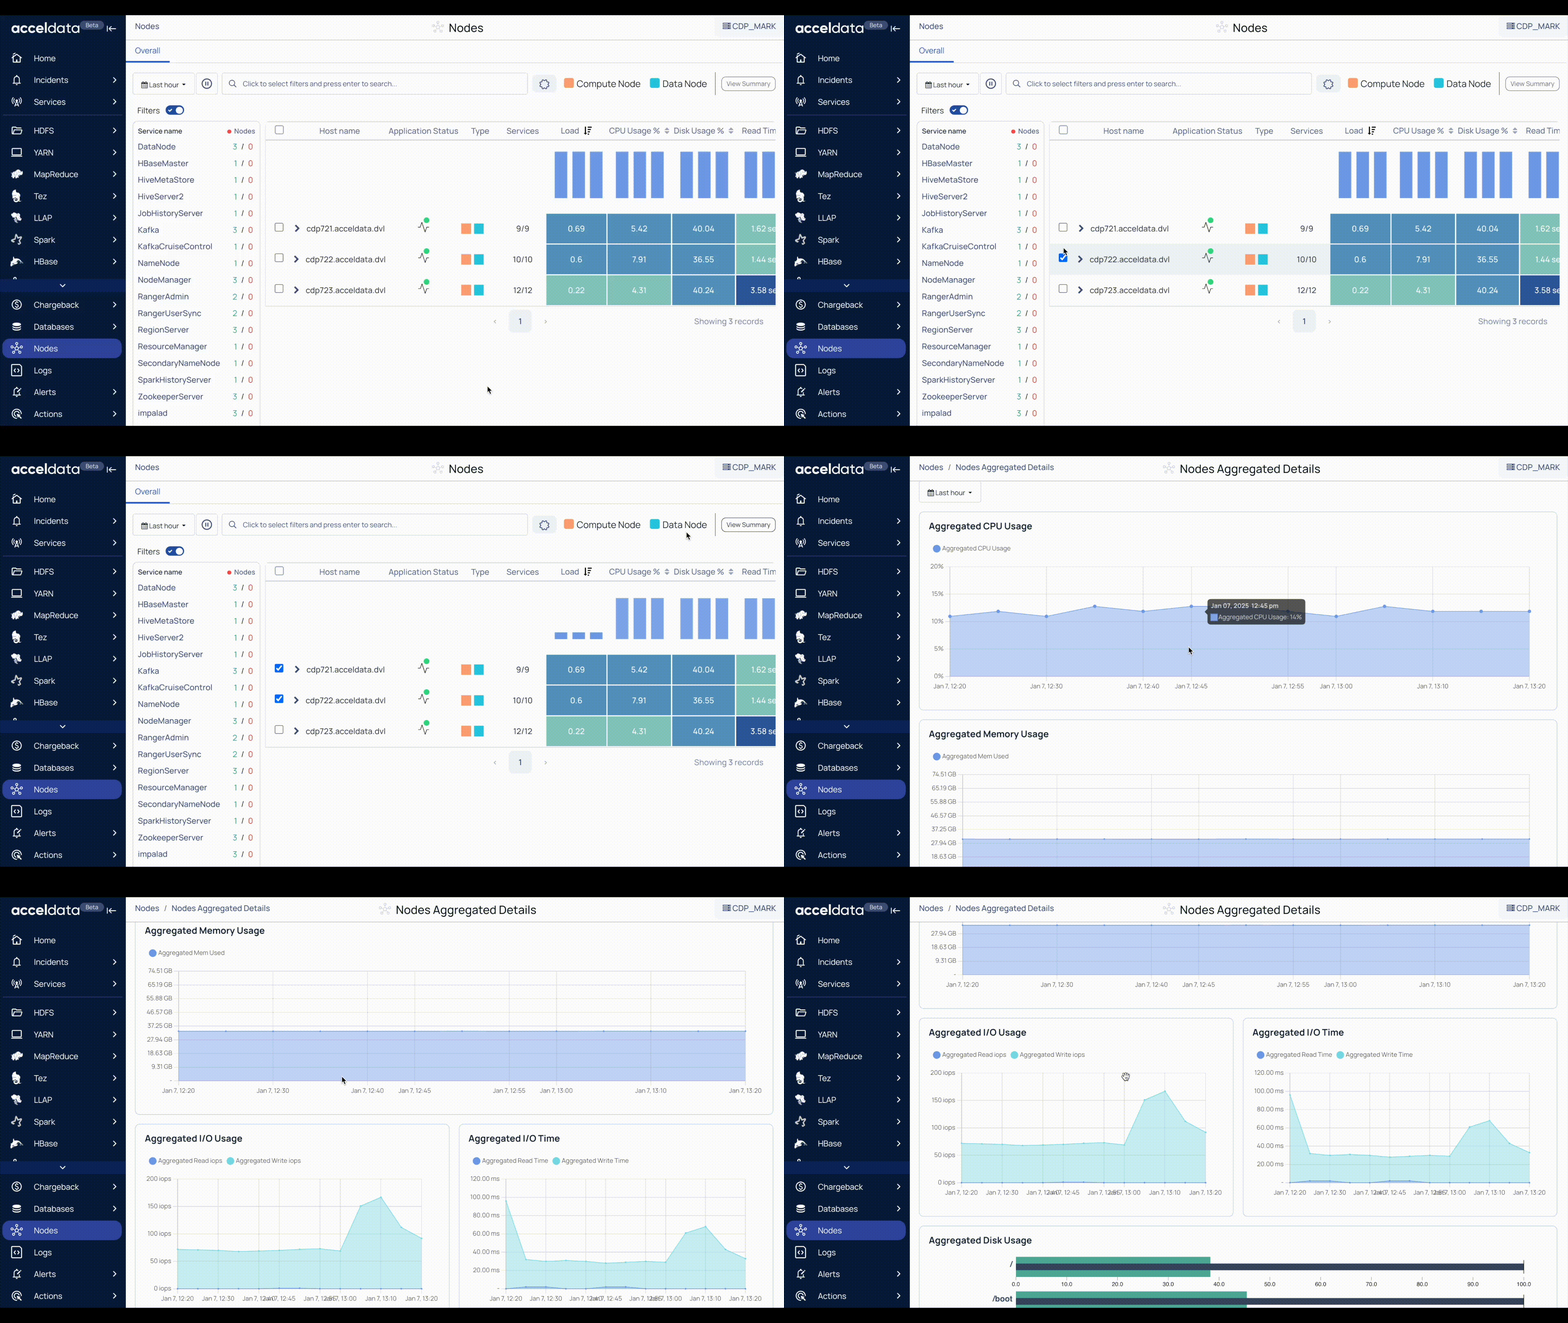
The Node Aggregated Details page displays the following charts.
Chart | Description |
|---|---|
Aggregated CPU Usage | The average amount of CPU utilized by the nodes. |
Aggregated Memory Usage | The amount of memory utilized by the nodes. |
Aggregated I/O Usage | The number of input bytes read and the number of output bytes written to the nodes. This chart displays the data per second for Aggregated Read IOPS and Aggregated Write IOPS. |
Aggregated I/O Time | The time utilized by input/output operations. This chart displays Aggregated Read Time and Aggregated Write Time (in ms) of I/O operations in the nodes. |
Aggregated Disk Usage | The total amount of disk used by the nodes on the boot drive and mounted storage. This disk usage is displayed in % for these partitions. |