
About the Application Explorer Page
The comprehensive analysis of YARN workloads provides detailed insights, including the application name, type, ID, final status (Succeeded or Failed), user, memory and CPU usage, job completion time, and the list of hosts where the application executed its jobs. These details enable efficient monitoring, resource optimization, and troubleshooting.
Steps to access the Application Explorer page to analyze the Yarn Workloads:
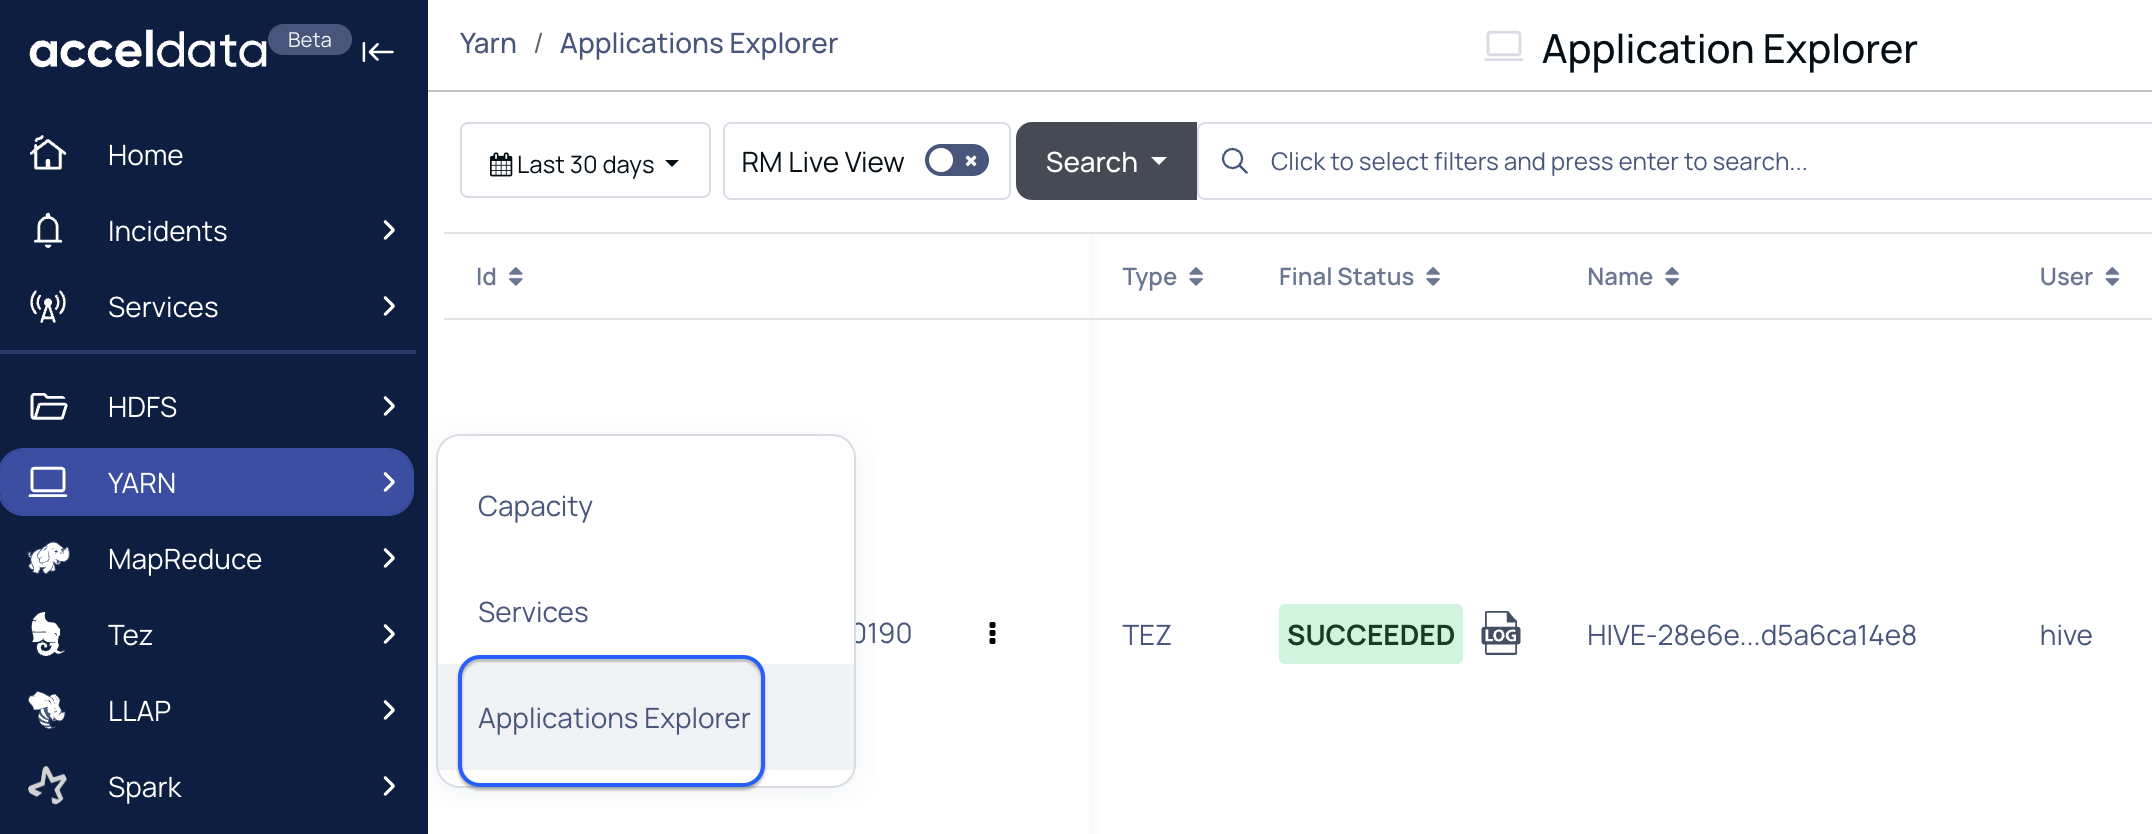
- Log in to Pulse UI and select YARN from the left navigation menu.
- On the YARN pane, select Application Explorer. The Application Explorer page appears with workload details.
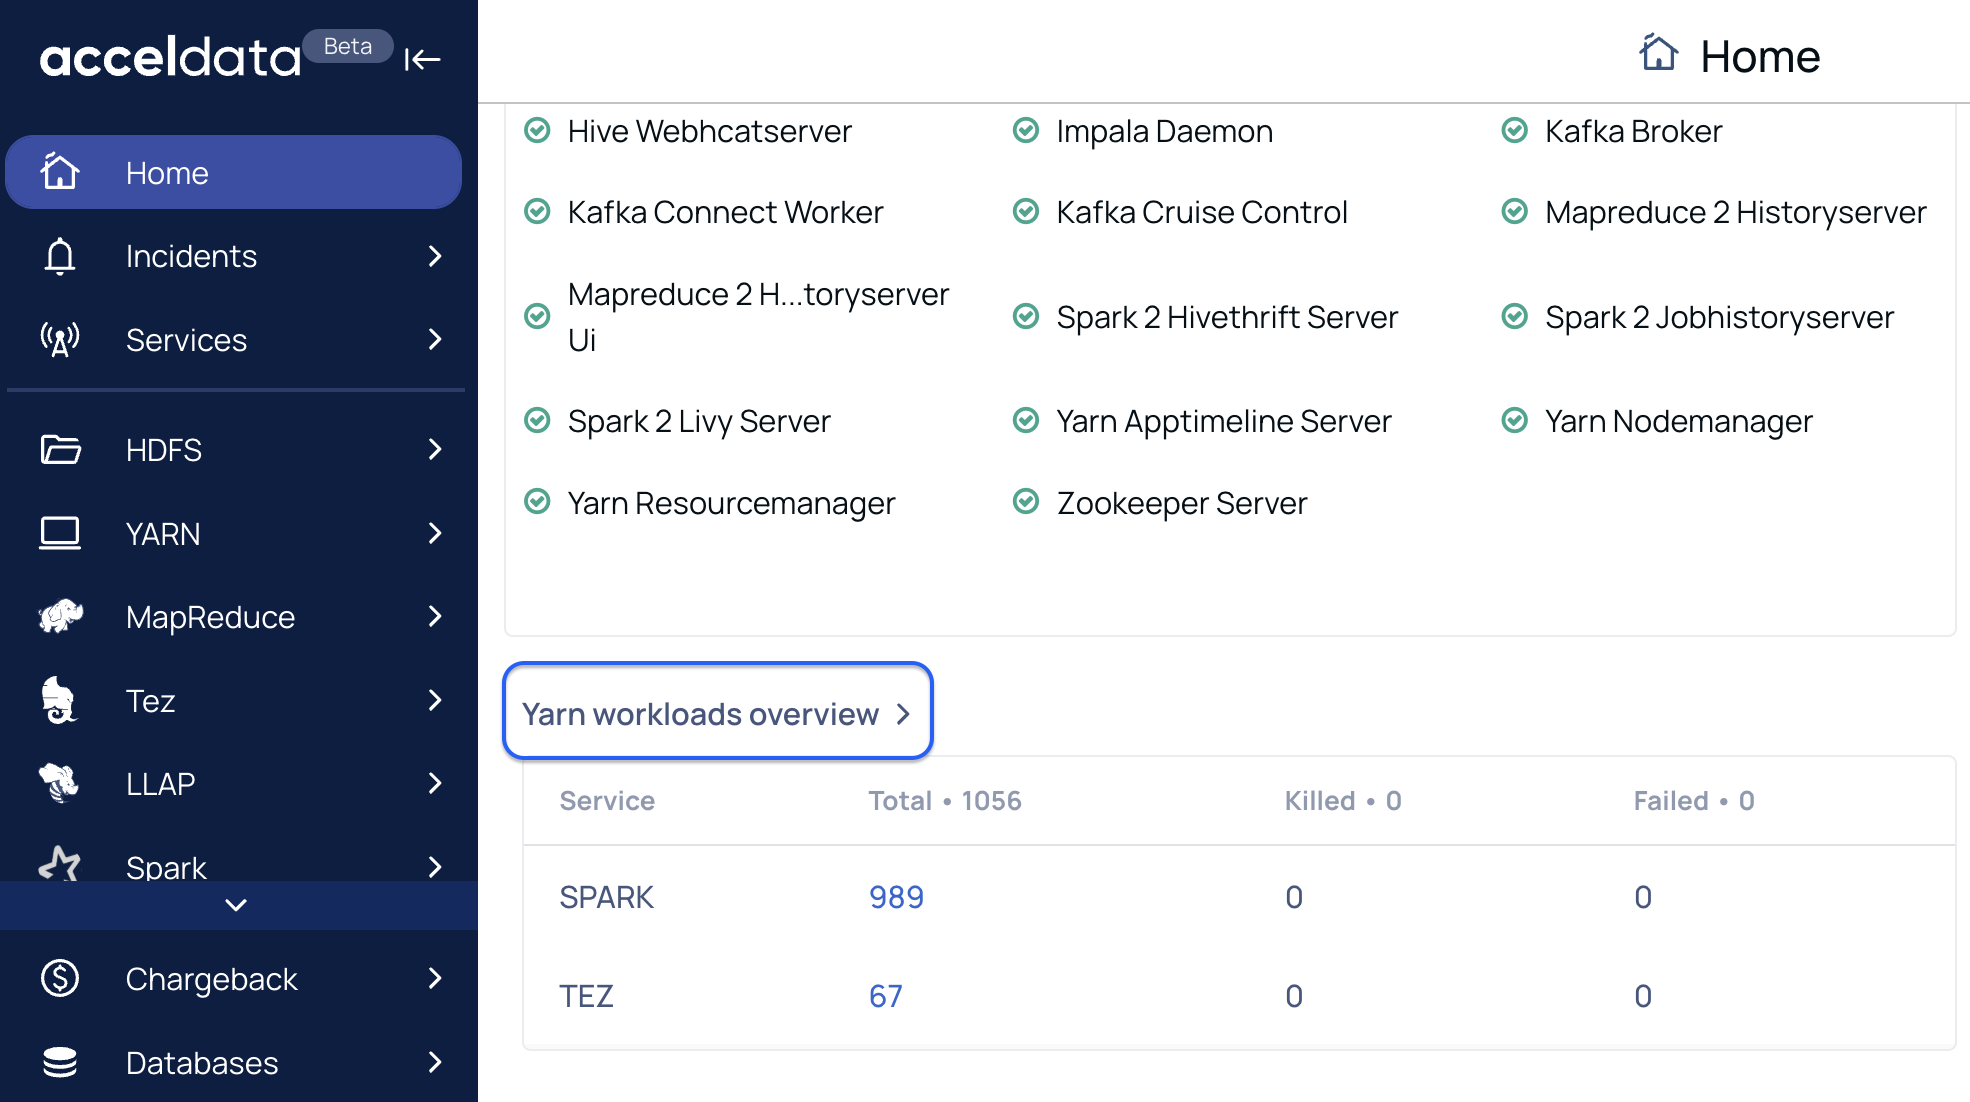
You can also navigate to the Pulse UI Home page > click on Yarn Workloads Overview to access the Explorer page.
For details on the metrics, see Monitoring the Application Metrics.