
Node Details
The Node Details page enables you to get further metrics details about nodes, such as the applications running, the number of containers used, total allocated memory, etc., and charts of those metrics.
- Log in to the Pulse UI. On the Home page, click on Overview.
- On the Nodes page, click on Hostname.
Important
The Hosts manage and run multiple nodes.
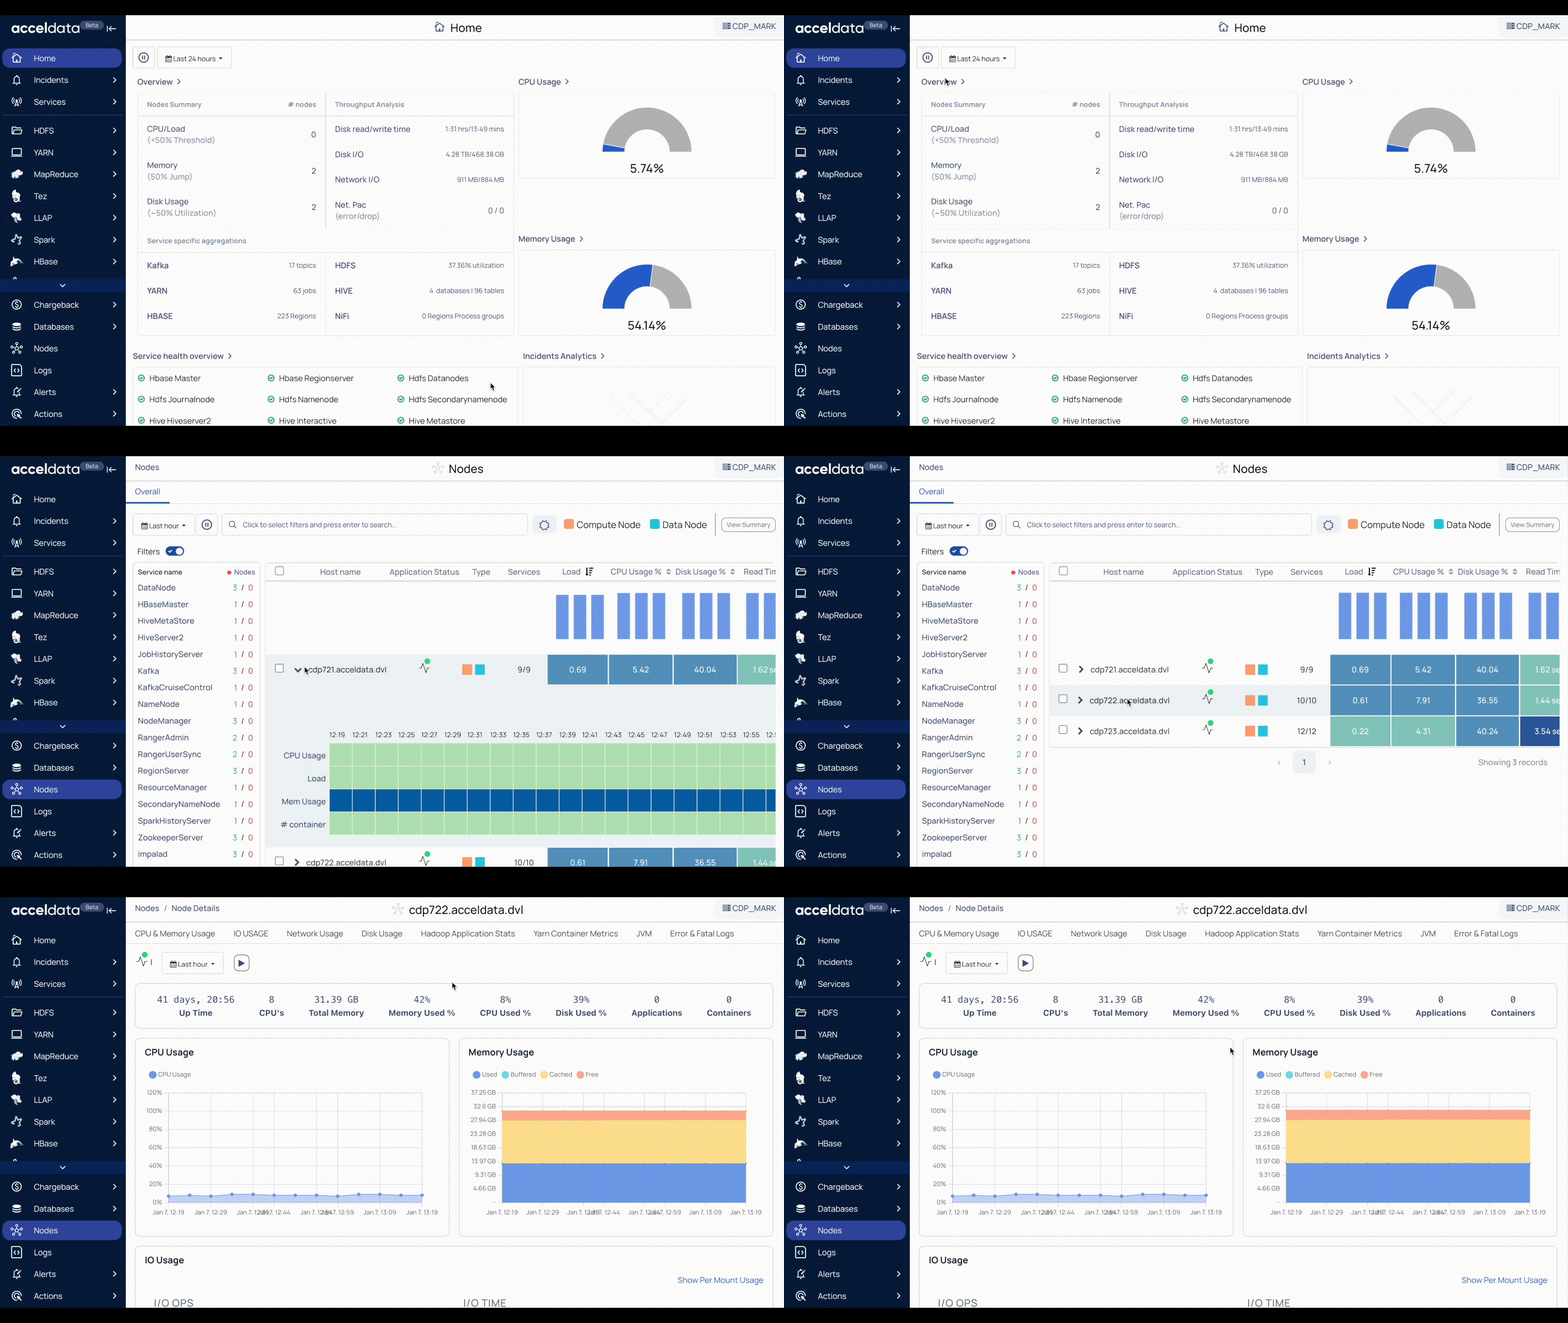
The Node details page provides the following functionalities:
Functionality | Description |
|---|---|
Summary Panel | This panel provides a node's metrics such as CPU and Memory Usage, IO Usage, Network Usage, Disk Usage, etc. |
Service Status | This service status icon denotes the status of the services running on the node. A notification of 1 indicates that one service is down on that node. Click the icon to know which service is down. |
Timestamp | Choose an option to select a time period (For example, Today, Last 12 hours, Last 3 Months, etc.) or choose a “custom date and time” of your choice and click Apply. |
Refresh the Status | Click the ⏵ (Play) and ⏸ (Pause) buttons at the top left of the page, to toggle between play and pause respectively. Click the Play button to refresh the cluster status every ten seconds and the Pause button to temporarily stop the refresh. |
Charts | This Charts functionality provides a graphical representation of the node’s metrics. |
Summary Panel
The summary panel provides the following metrics with details.
Metric | Description |
|---|---|
Up Time | The time that the node is available and running. |
CPU's | The number of CPUs in the node. |
Total Memory | The total memory allocated to the node. |
Memory Used % | The amount of memory used (in %). |
CPU Used % | The amount of CPU used (in %). |
Disk Used % | The amount of Disk used (in %). |
Applications | The number of applications running on the node. |
Containers | The number of containers used in the node. |
Charts
You can monitor the following metrics charts on the Nodes details page.
Chart | Description |
|---|---|
CPU Usage | Displays the amount of CPU utilized by the node. |
Memory Usage | Displays the amount of Memory utilized by the node. You can view the usage of the following memory types: |
IO Usage | The IO Usage charts describe the number of input bytes read and the number of output bytes written to a node. The following IO metrics are displayed: Note: Click Show Per Mount Usage to view I/O usage on every mount in the node. |
Network Usage per Second | This chart displays the network throughput measured for every second. You can monitor the following network statistics: Note To view individual network usage statistics of processes in the node, click Show Individual. By default, the aggregated value is displayed. |
Disk Usage | This chart displays the amount of disk used by the node in directories. The value is displayed in %. Hover the scale to view the disk usage. |
Hadoop Application CPU and Memory Usage | This tile displays the top five memory-intensive and CPU-intensive processes running on a node, at the top and the charts display the amount of memory and CPU utilized by the processes in the node (in MB). |
Yarn Container Metrics | This chart displays the launch duration of containers. |
JVM GC Count | The chart displays the amount of GC memory used based on the following metrics: |
JVM GC Time | The chart displays the GC time based on the following metrics: |
Error & Fatal Logs | Error & Fatal Logs is a table that displays all the errors that have occurred. It displays the Log Time and Message about the error. The Error & Fatal Logs tile displays the logs of any errors or unexpected behavior on the node. The table stores the following column details: Click the log icon to view all Logs. |